
Original Document: Messung von verschiedenen Strebenprofilen (German original, Word document)
Document Date: September 4, 2000
Author: University of Stuttgart
Testing Administrator: Carsten Friedricks (on behalf of Wills Wing)
Wills Wing Profiles: Designed and provided by Steven Pearson
1. Test Setup
All measurements were conducted at the model wind tunnel of the University of Stuttgart. The angle of attack was measured using a precision potentiometer, lift was measured using a strain gauge load cell, and drag was determined using a wake rake. While angle of attack and lift coefficient are measured directly, drag measurement requires evaluation of various measured pressures through an evaluation program.
The following measured values are required for determining profile drag:
- (Free stream) dynamic pressure upstream of the profile
q∞ = ½ ρ V∞2
For wake rake measurements: q∞ = pt∞ − ps∞ (total minus static pressure)
- Maximum total pressure in the rake center
Δpt,max = pt∞ − pt,max
- Integral total pressure across the entire rake width
Δpt = pt∞ − pt,wake
- Static pressure difference in the wake deficit
Δps = ps∞ − ps,wake
Figure 1: Measurement Setup
In this type of drag measurement, care must be taken that the width of the wake rake is adapted to the width of the wake deficit, or the distance of the rake from the trailing edge of the profile x/c is chosen so that the width of the wake rake is utilized as well as possible to achieve the best possible resolution and thus minimize measurement error.
2. Investigated Geometry Definitions
Various profiles from Wills Wing and other strut tubes widely used in hang glider construction were available for wind tunnel investigations. Additionally, the influence of various turbulators was investigated on some profiles. The numbering of the profiles corresponds to the numbering according to the order (see appendix).
1.1 Wills Wing Carbon in original configuration (chord length 76.5mm, profile thickness 19.9mm, relative profile thickness 26%) with trip edge (approx. 1×1mm) at 25% chord length
1.2 Wills Wing Carbon with 3D turbulator (thickness 0.5mm, width 10.5mm, wedge angle 60°) with trailing edge at 25% chord length
1.3 Wills Wing Carbon with V-shaped embossed vinyl tape, embossing thickness 0.6mm, tape depth 9.5mm, V-embossing depth 4mm, trailing edge at 25% chord length
1.4 Wills Wing Carbon without turbulator
2.1 Seedwing strut profile made of aluminum (chord length 62.4mm, profile thickness 25.2mm, relative profile thickness 40.38%) with trip edge (approx. 0.5×0.5mm) at 8% chord length
3.1 Aluminum round tube as unprofiled strut for reference measurements, diameter 28.575mm
3.2 Aluminum round tube as unprofiled strut with 3D turbulator (thickness 0.5mm, width 10.5mm, wedge angle 60°) at 30% chord length
4.1 Finsterwalder strut profile made of aluminum (chord length 49.2mm, profile thickness 25.9mm, relative profile thickness 52.64%) with trip edge (approx. 0.5×0.5mm) at 5% chord length and draw mark (approx. 0.3×0.3mm) at 44% chord length
4.2 Wills Wing Aluminum standard strut (chord length 50.5mm, profile thickness 26.2mm, relative profile thickness 51.88%) with trip edge (approx. 0.5×0.5mm) at 33% chord length and draw mark (approx. 0.3×0.3mm) at 50% chord length
5.1 Wills Wing Aluminum in original configuration (chord length 76.6mm, profile thickness 20.2mm, relative profile thickness 26.37%) with trip edge (approx. 0.5×0.5mm) at 10% chord length
5.2 Wills Wing Aluminum with V-shaped embossed vinyl tape, embossing thickness 0.6mm, tape depth 9.5mm, V-embossing depth 4mm, leading edge at 10% chord length
3. Test Conditions
All profiles were measured at the same freestream velocities (10m/s, 15m/s, 20m/s and 30m/s), with an angle of attack range from −15° to +15°. The measurement always began at −15° and then the angle of attack was increased in 1-degree steps.
Since all measured profiles are symmetrical, hysteresis effects can be detected by this procedure.
The measurement itself was carried out over a range of 100mm in the span direction (50mm from the center of the models to each side), with individual measurements taken at a distance of 1.5mm.
From the 67 measurement values obtained in this way, the average value for the drag coefficient was determined.
The lift coefficient was averaged over the entire measurement period of the drag measurement.
4. Measurement Setup
Due to the sometimes large turbulent separations on some profiles, drag measurement with a wake rake is not unproblematic. The resulting large-scale vortices lead to local oblique flows of the tubes on the wake rake, and furthermore, the energy of the vortices is not captured by the rake.
In the measurements, it emerged as another problem that the static pressure in the wake has not yet reached the level of the undisturbed pressure of the freestream flow even very far behind the models.
A standard wind tunnel correction is used for small pressure differences. The large pressure differences when measuring, for example, the circular cylinder cannot be reliably corrected. Therefore, only approximate values are given for these cases.
During the measurements, care was taken to ensure that profiles with similar expected results were measured with the same rake distances. For measurements 1.1–1.4, 2.1 and 5.1, a rake distance x/c = 2 (i.e., 2 times chord length) was chosen, for measurements 4.1 and 4.2 a distance of 3 times chord length. The correctness of these distances was verified by comparative measurements.
5. The Investigated Turbulators
Various turbulators were used in the measurements, some of which were created during the production of the profiles. The following types were used:
- Trip edges, i.e., extruded (for aluminum profiles) or laminated into the mold (for carbon profiles) 2D turbulators with rectangular cross-sections of dimensions 0.3×0.3mm and 0.5×0.5mm (dimensions are approximate)
- Zigzag band turbulators, as sometimes used in manned gliding. Dimensions see sketch, thickness approx. 0.5mm
- Embossing turbulators, i.e., vortex generators indicated from embossed tape. Dimensions also see sketch, tape thickness approx. 0.1mm, embossing thickness approx. 0.6mm
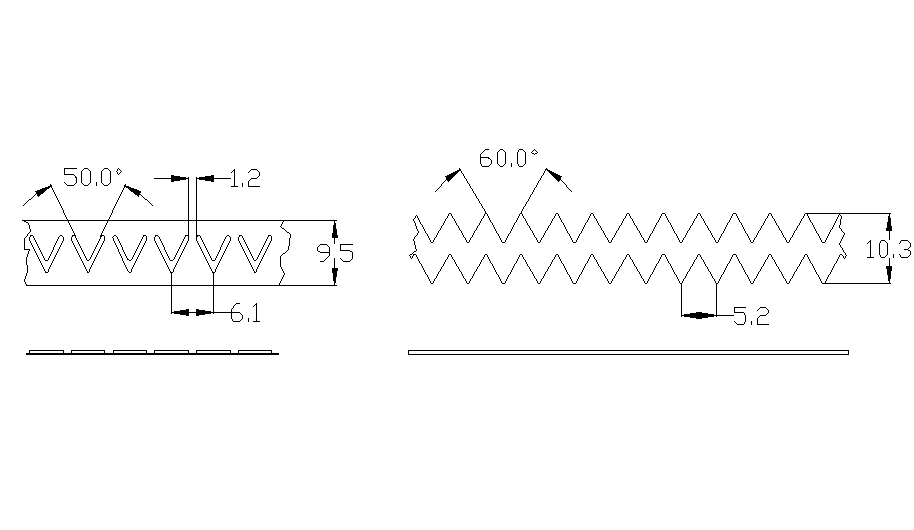
Figure 2: Embossing or zigzag band turbulator
Test Results
1.1 Wills Wing Carbon, Standard Trip
The carbon profile in the original configuration shows normal behavior in an angle of attack range of ±5 degrees. At larger angles of attack, turbulent separation occurs on the side with the higher angle of attack, causing an abrupt increase in drag to values between 0.1 to 0.2. This varied with speed and angle of attack.
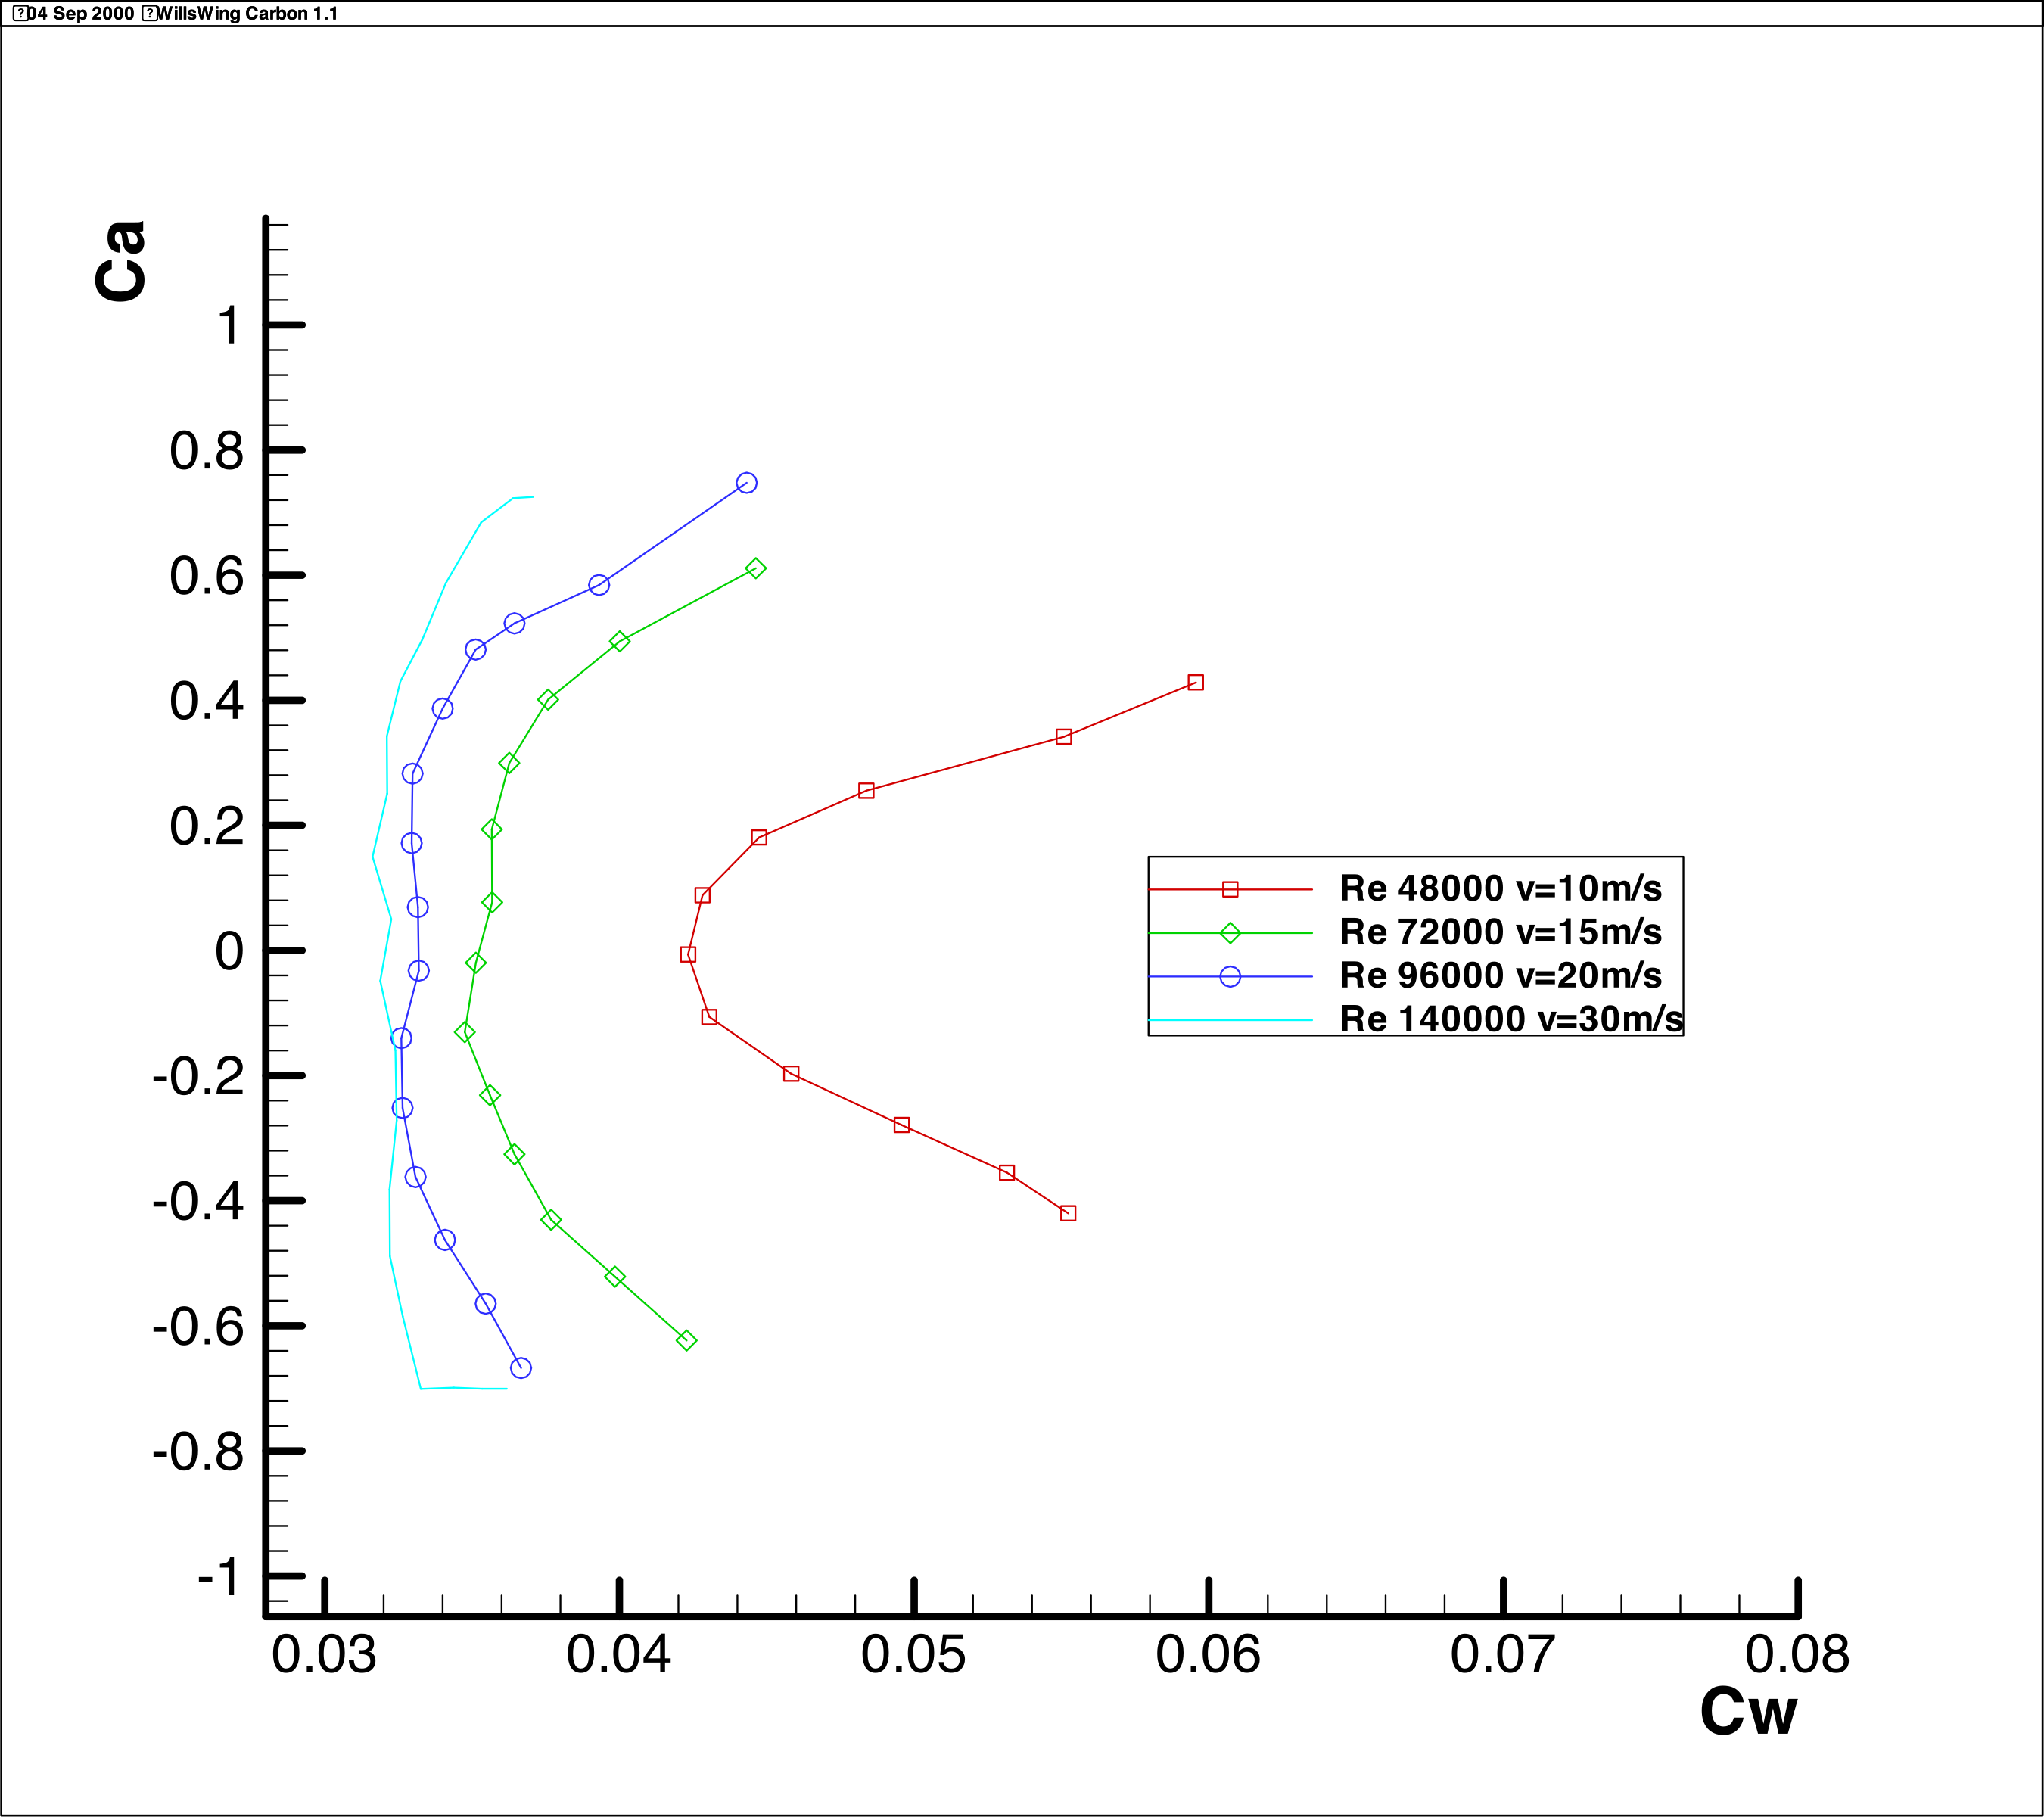
Figure 1.1-1: CL-CD Diagram Wills Wing Carbon 1.1
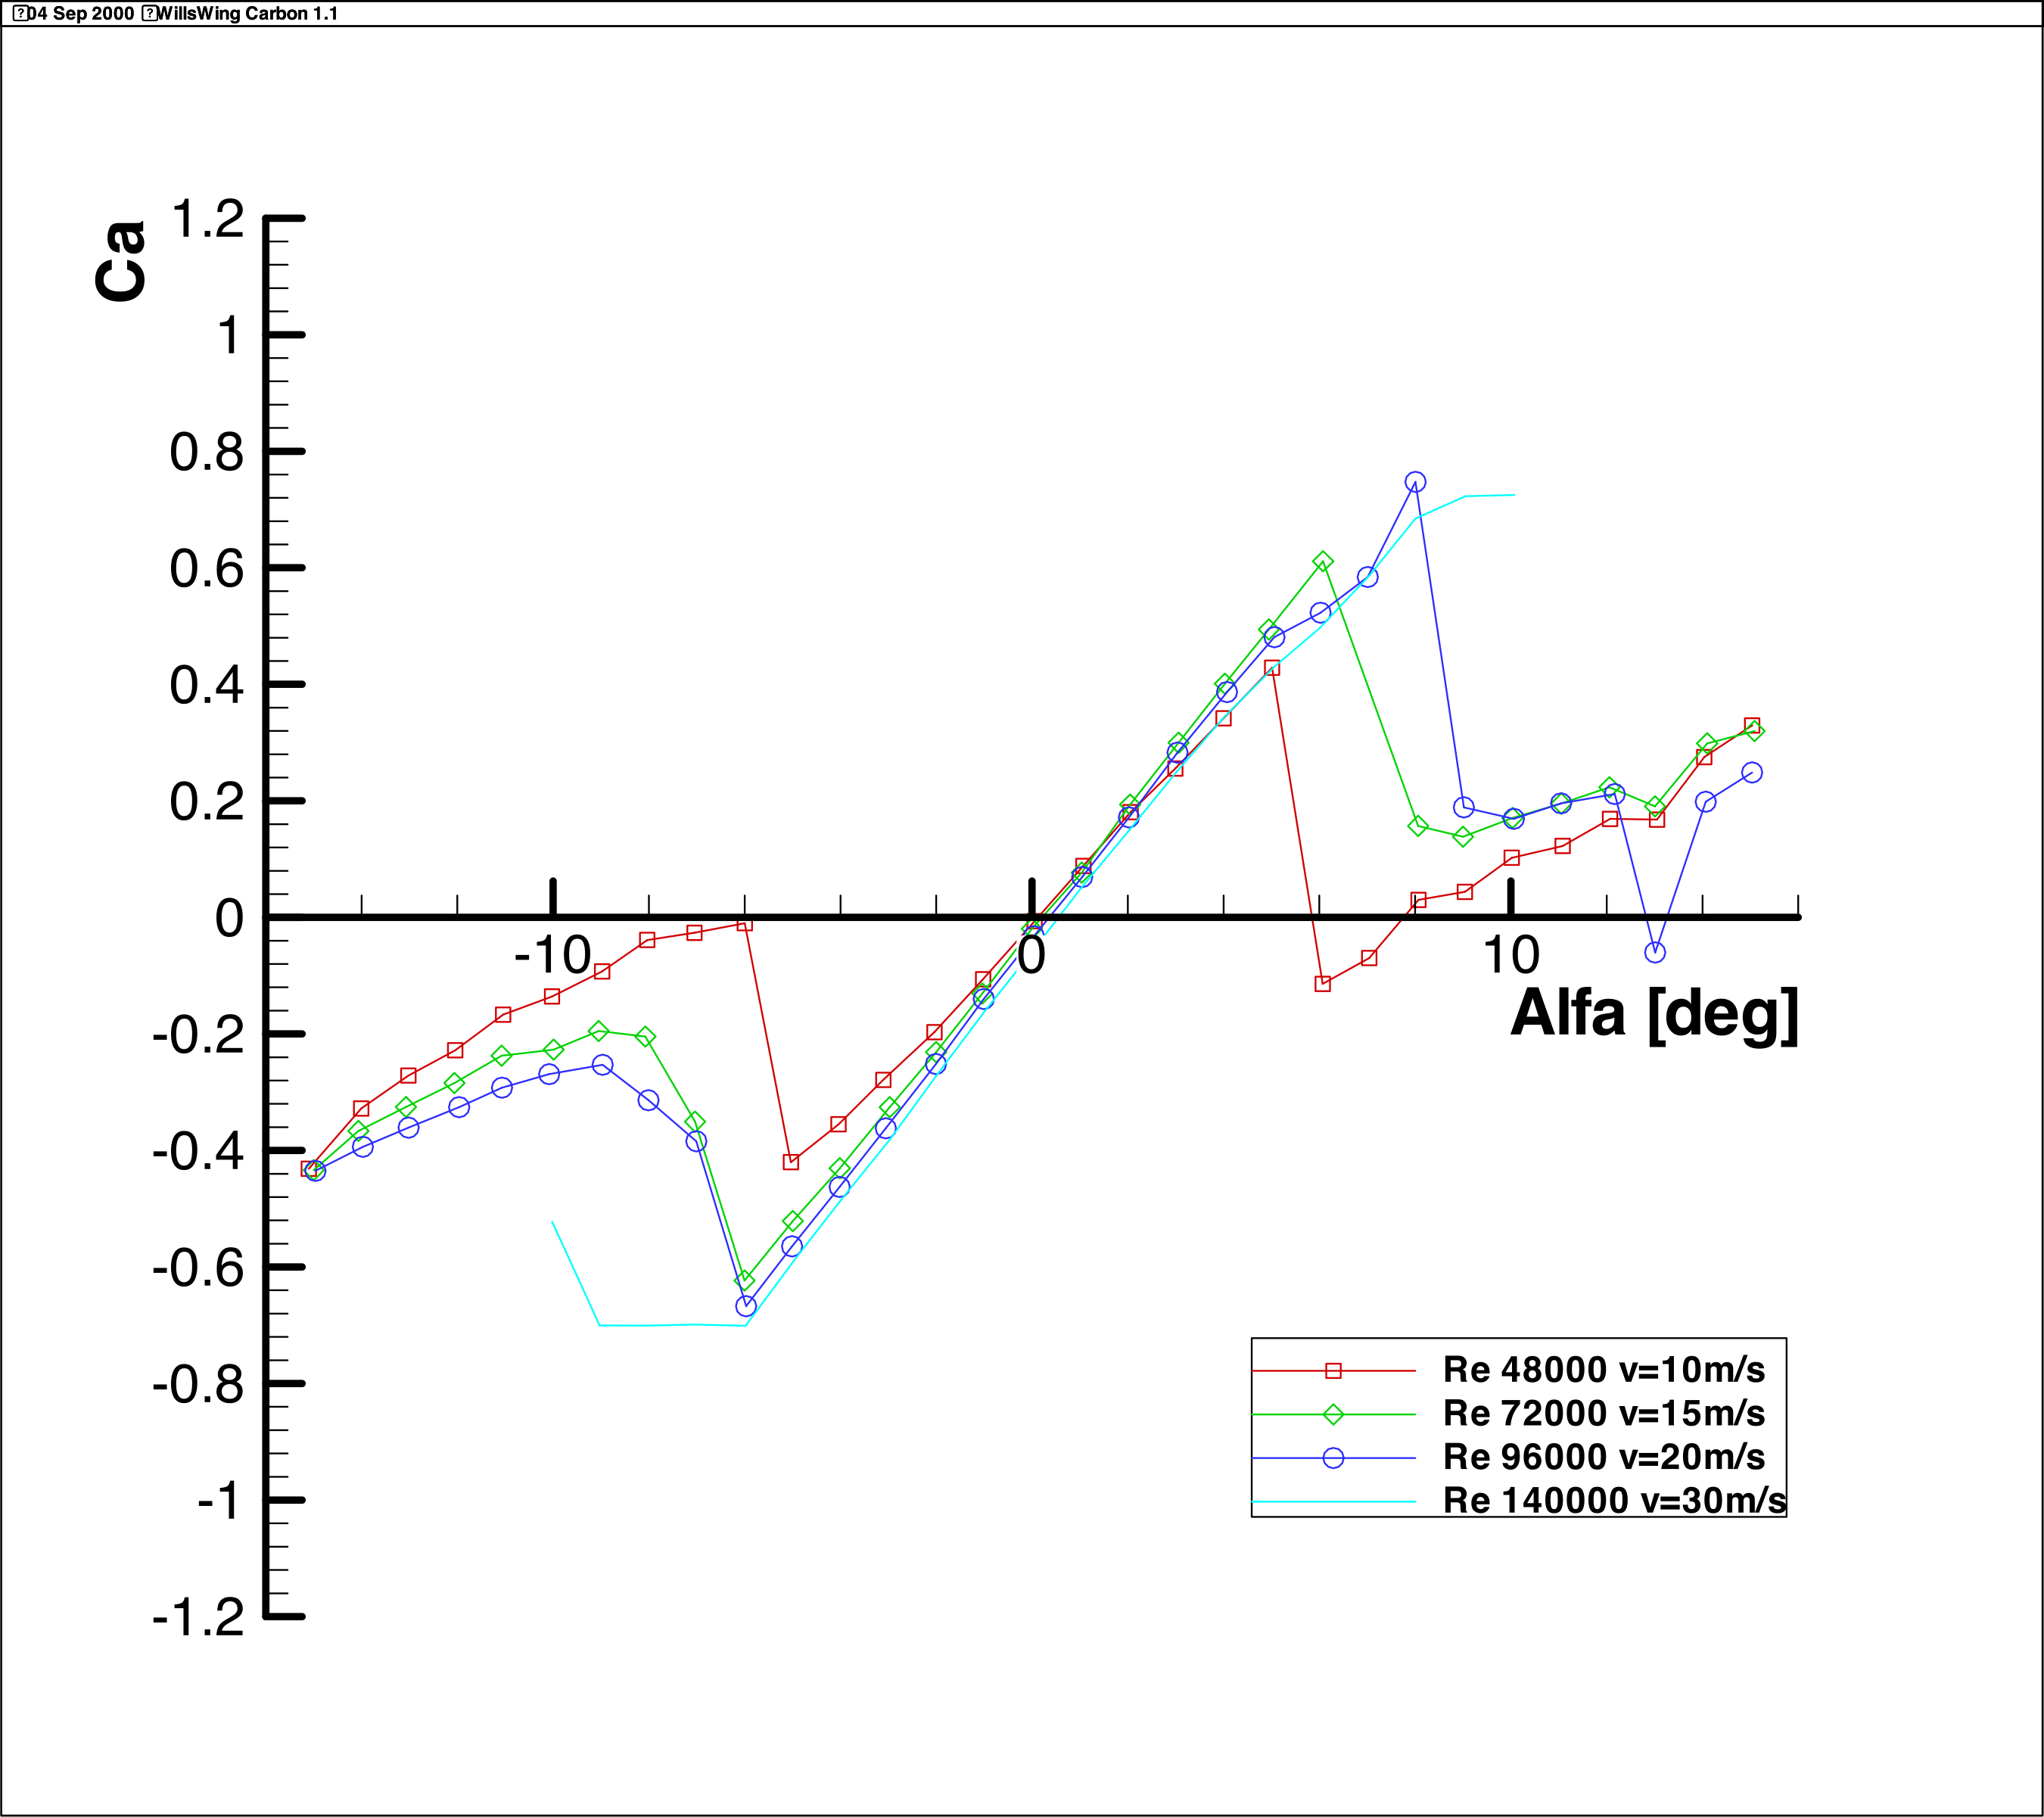
Figure 1.1-2: CL-α Diagram Wills Wing Carbon 1.1
1.2 Wills Wing Carbon, Zig-Zag Trip
By applying a relatively thick (0.5mm) 3D turbulator, separation and thus the abrupt drag increase can be delayed to an angle of attack range of ±8 degrees. The drag coefficients after separation correspond to those from 1.1. This results in an increase in the usable angle of attack range by approximately 50%.
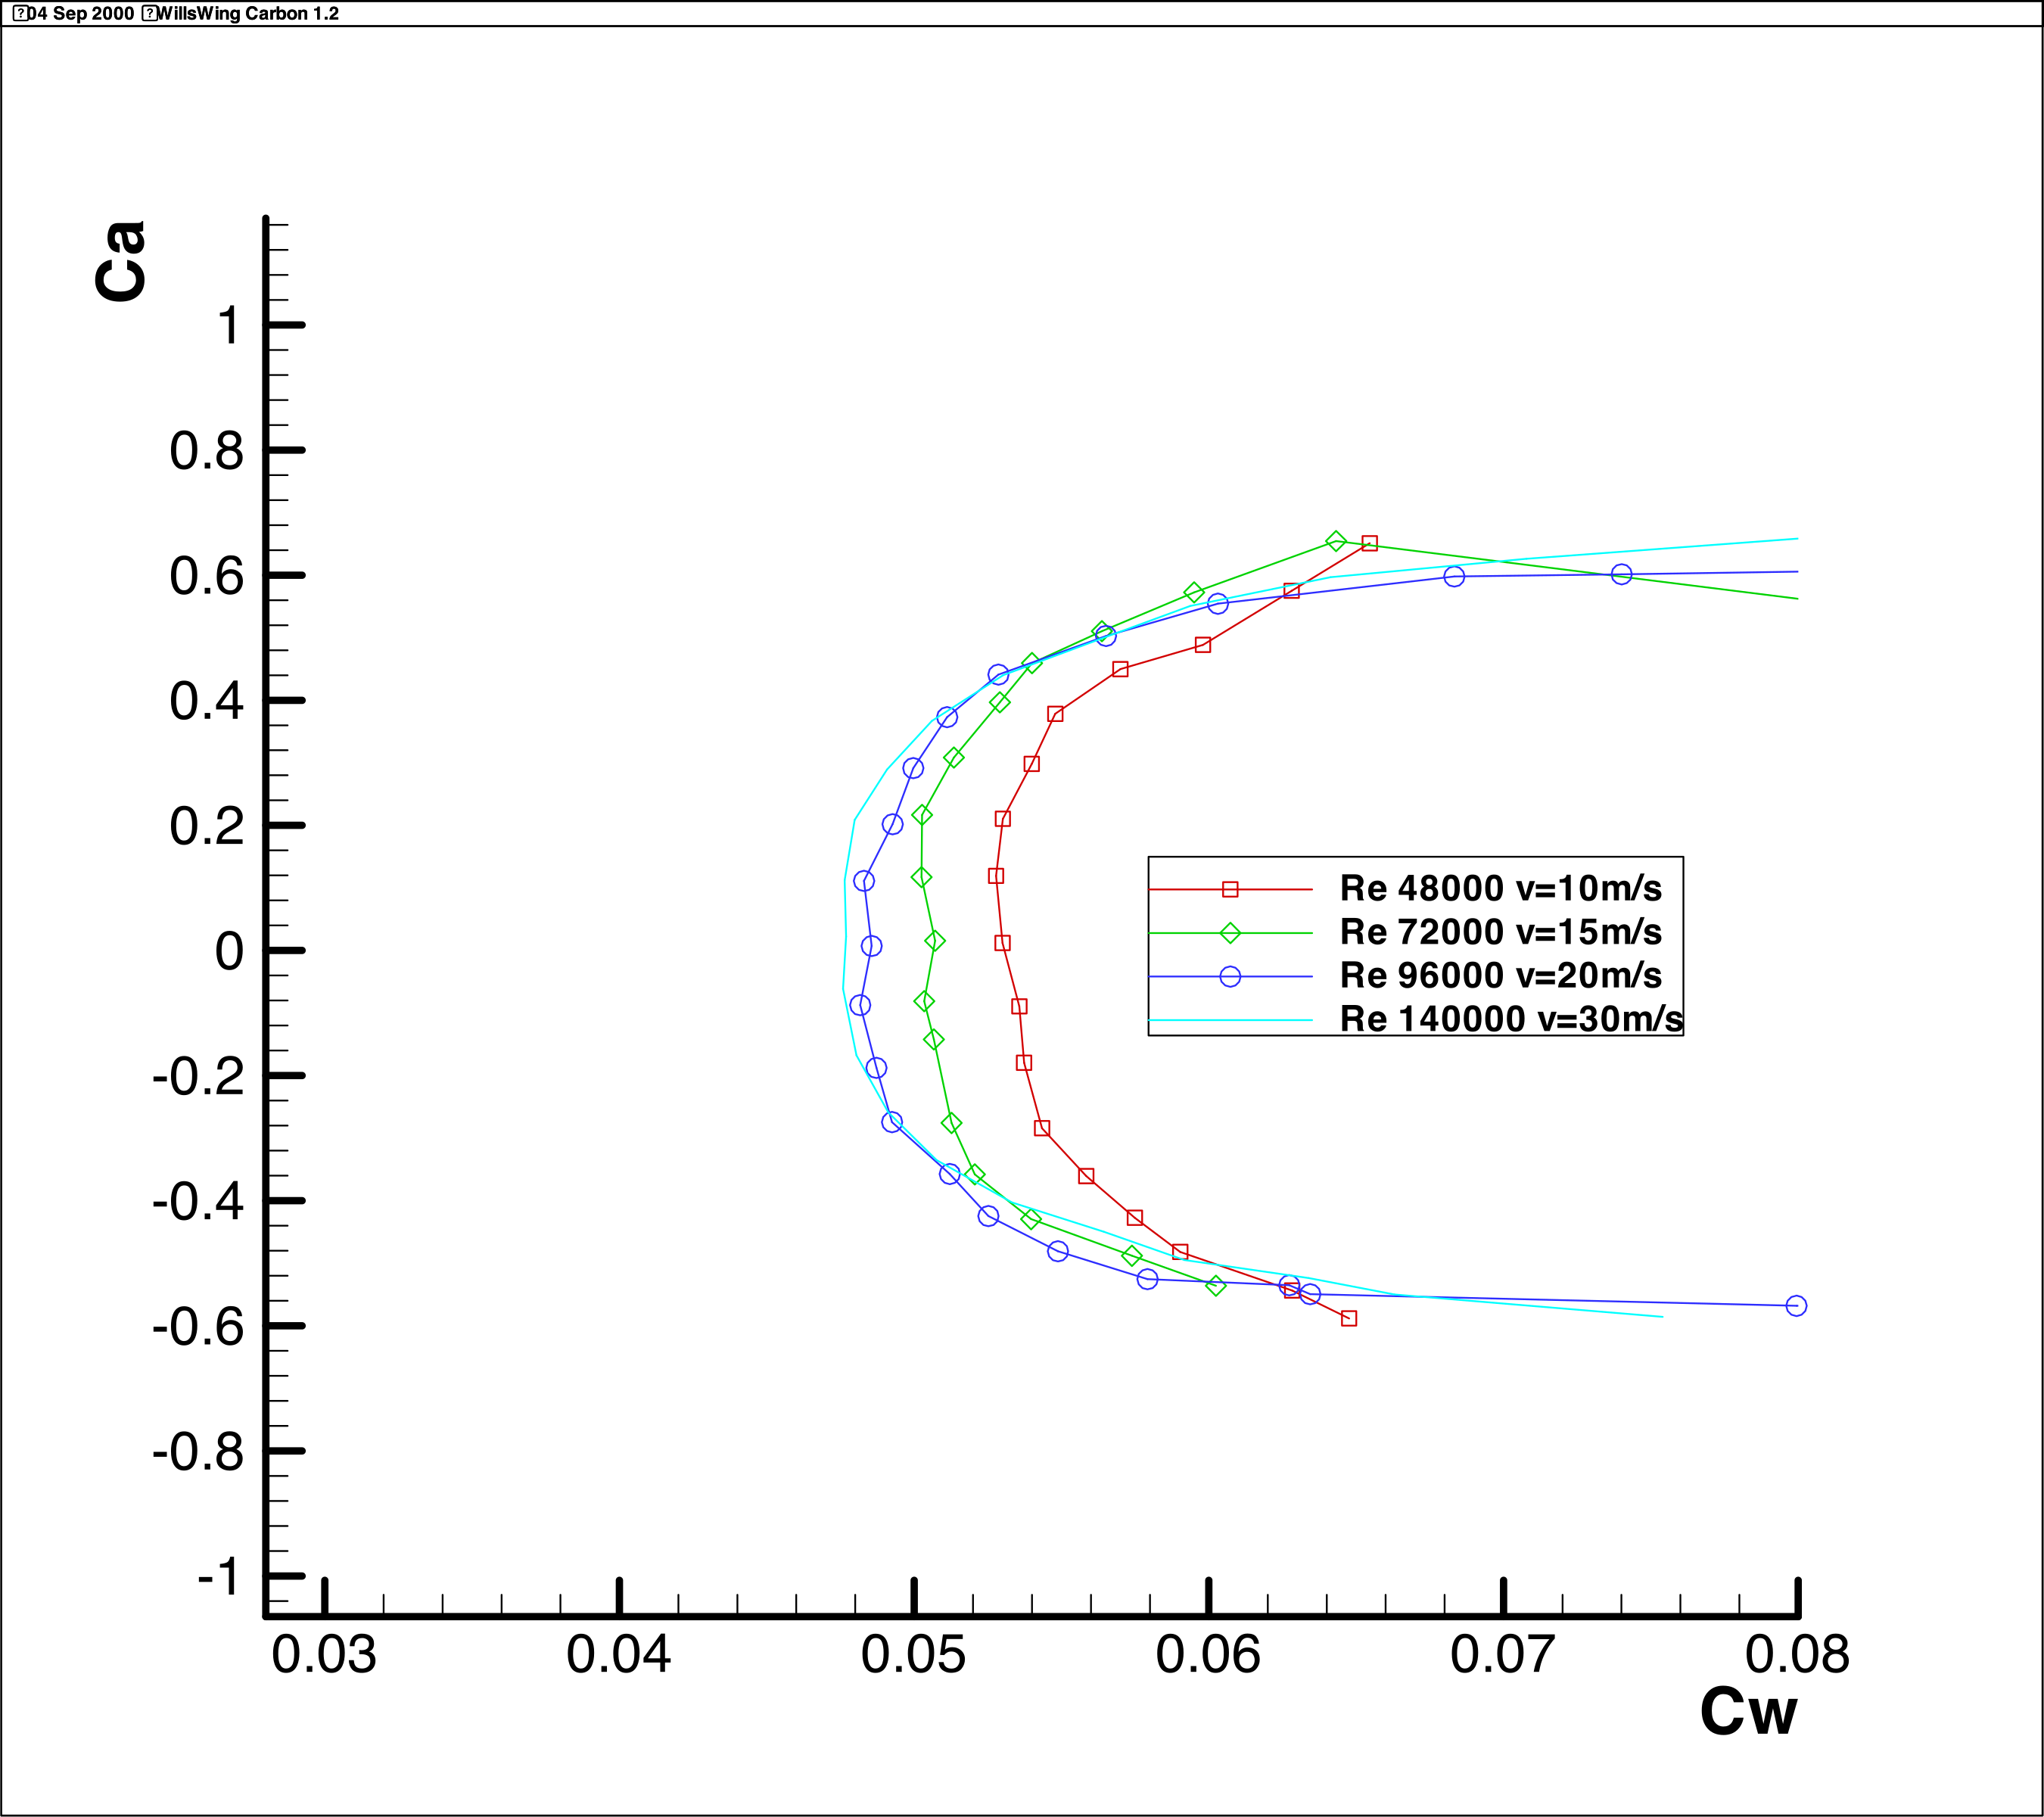
Figure 1.2-1: CL-CD Diagram Wills Wing Carbon 1.2
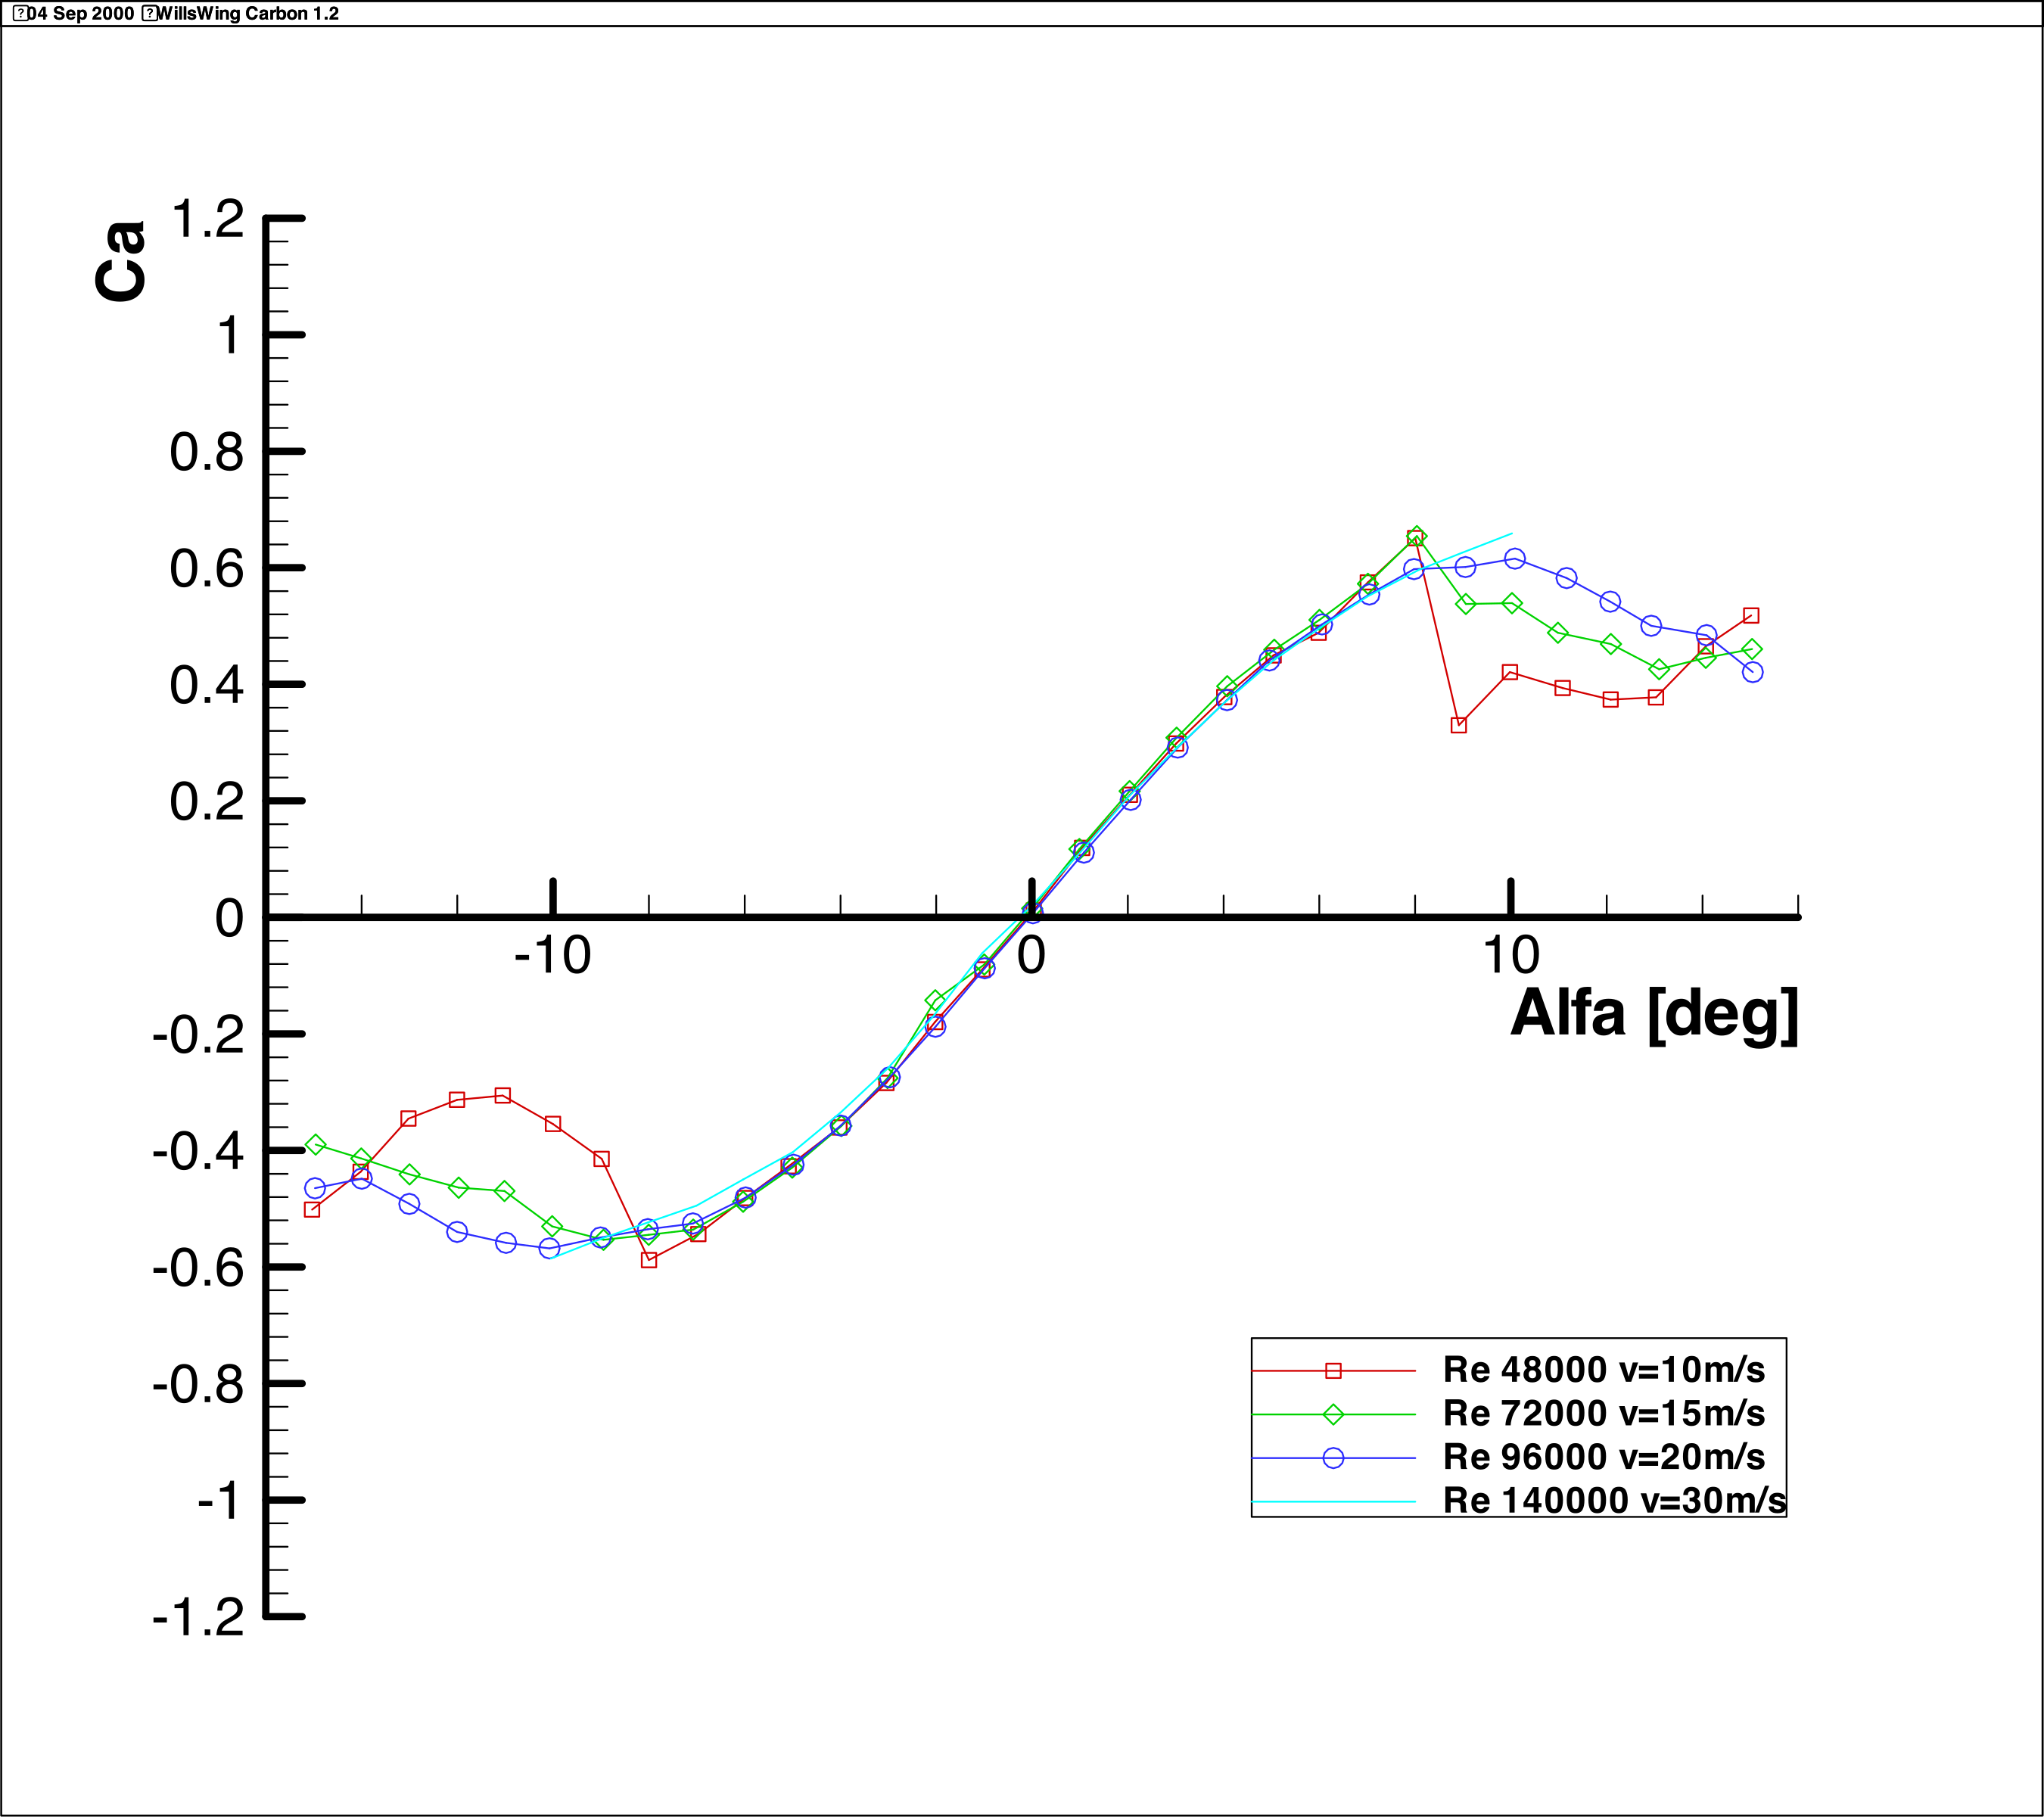
Figure 1.2-2: CL-α Diagram Wills Wing Carbon 1.2
1.3 Wills Wing Carbon, Vinyl V-Trip
The use of an indicated vortex generator extends the angle of attack range of the profile where no turbulent separation occurs to approximately ±10 degrees with a drag increase of approximately 15%. However, this configuration caused very strong noise emission (single tone) at a speed of 30m/s at angles of attack of ±2 degrees.
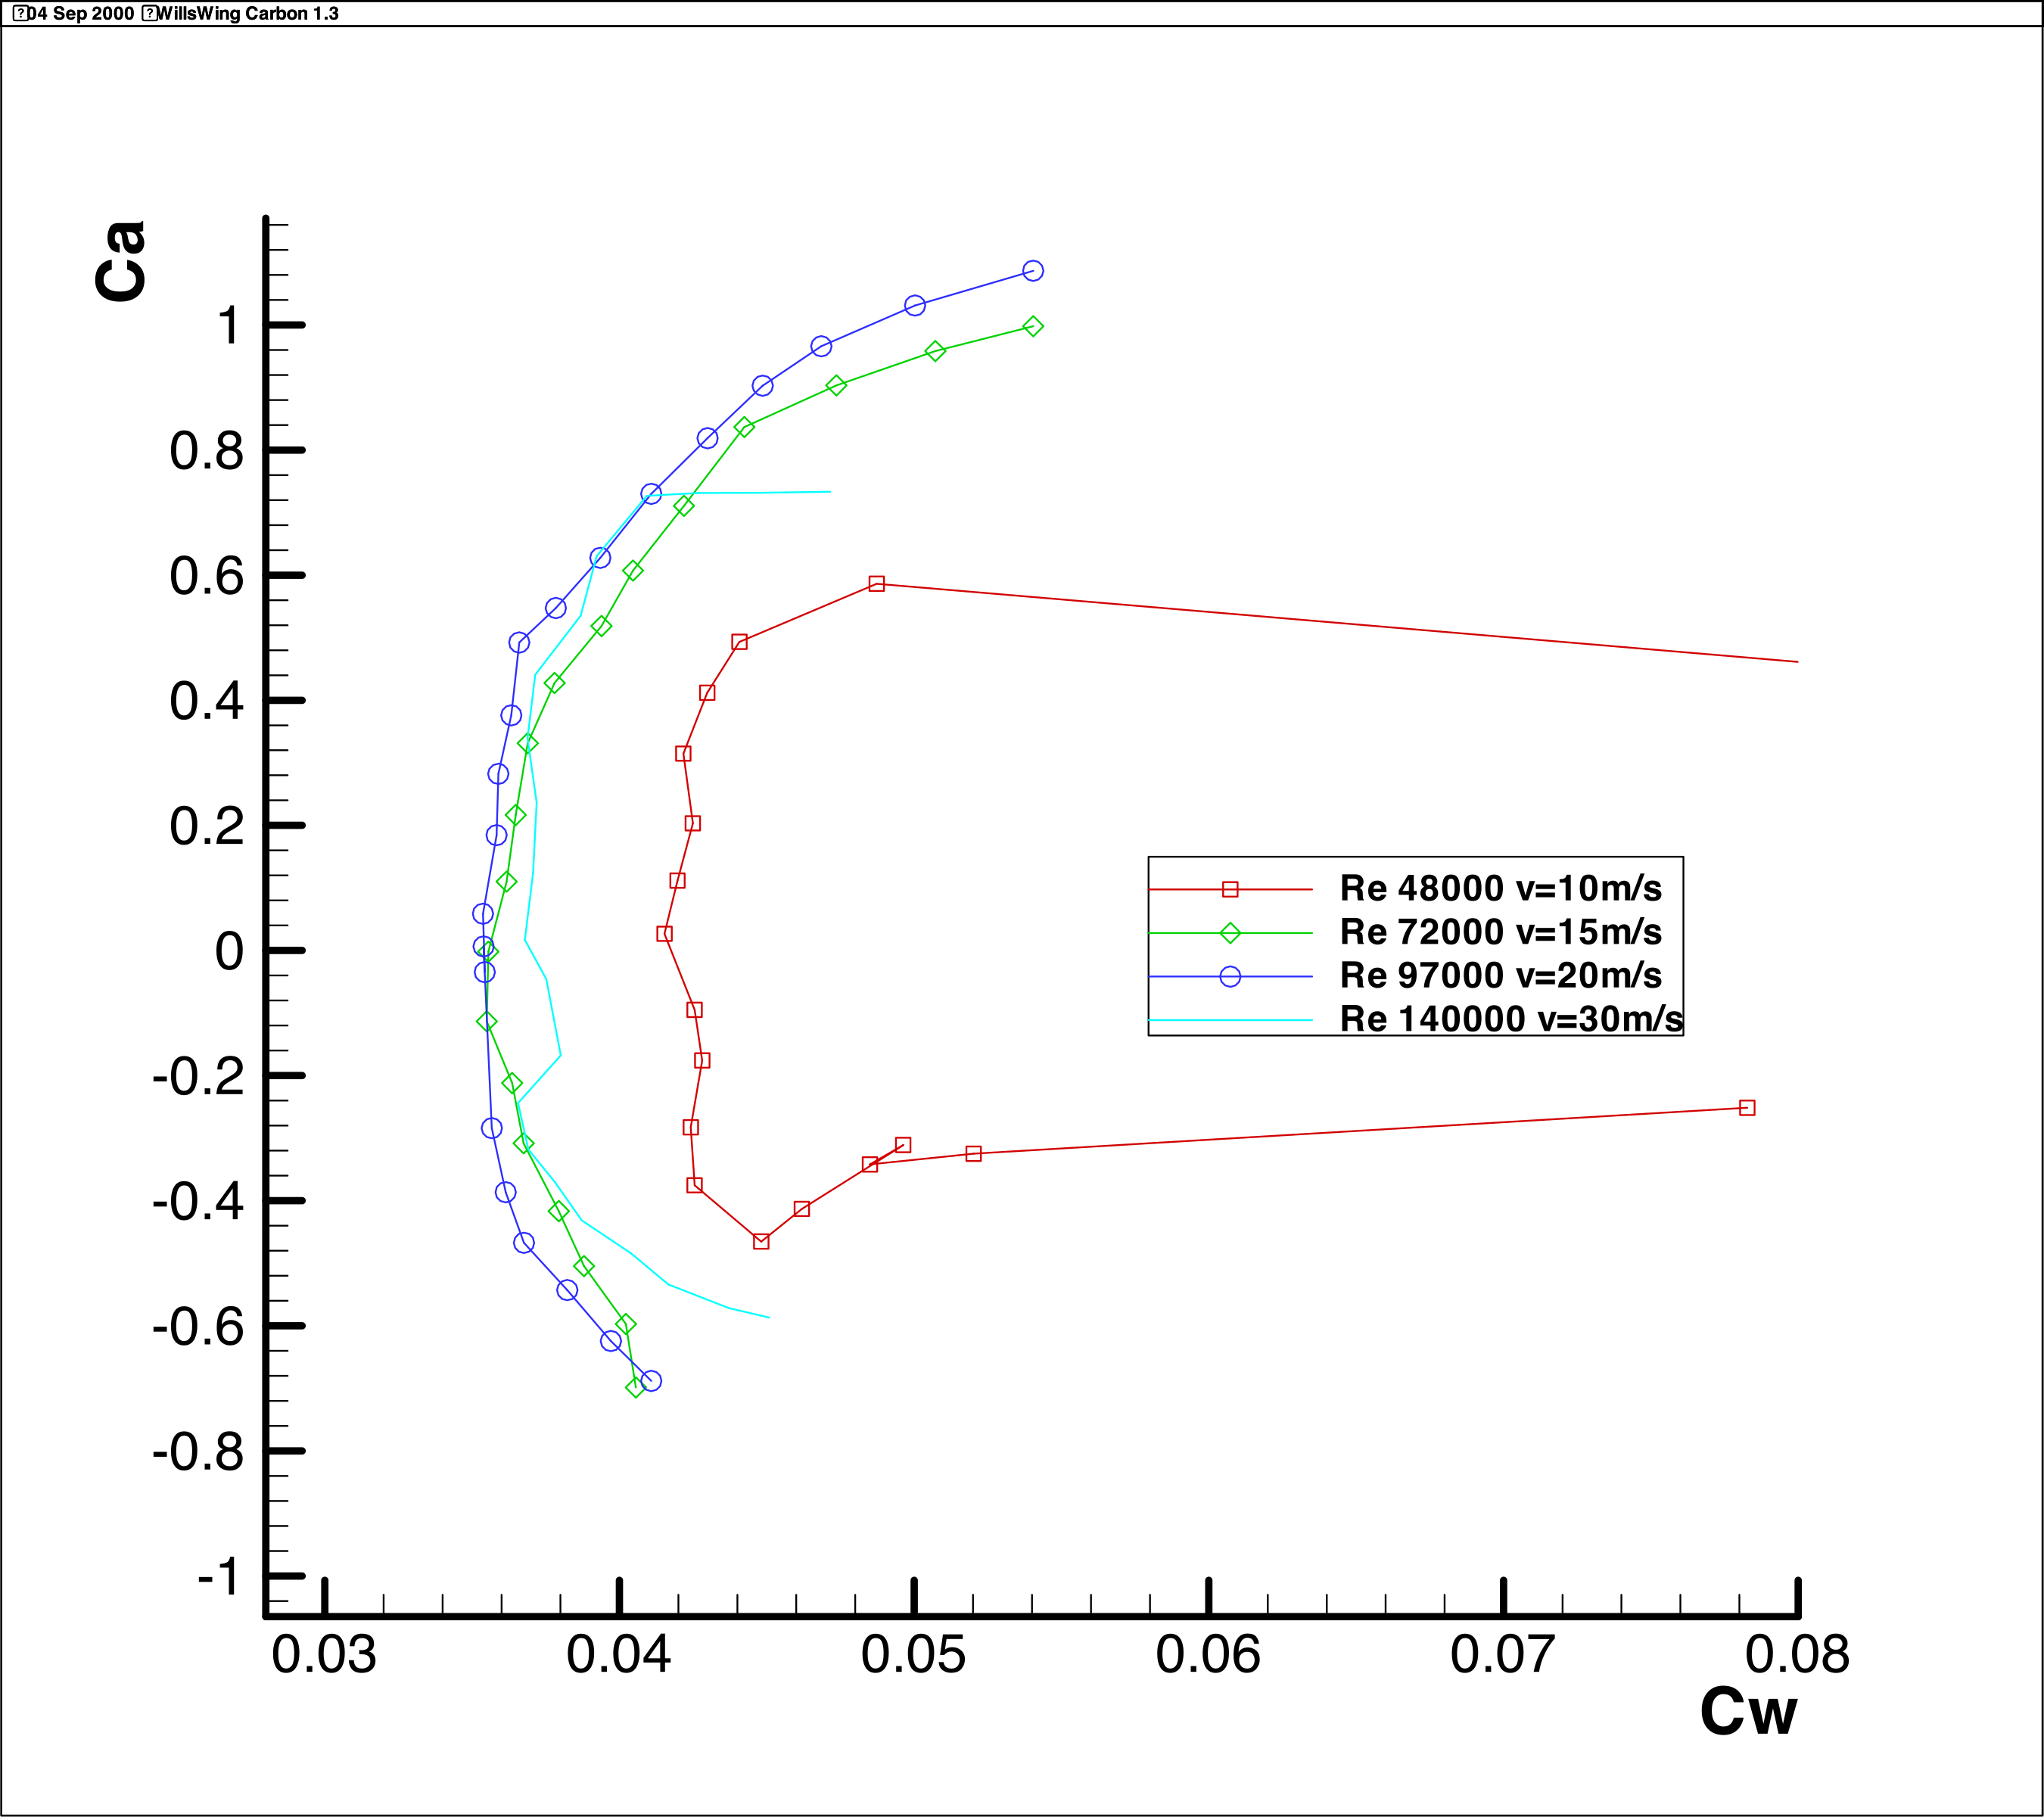
Figure 1.3-1: CL-CD Diagram Wills Wing Carbon 1.3
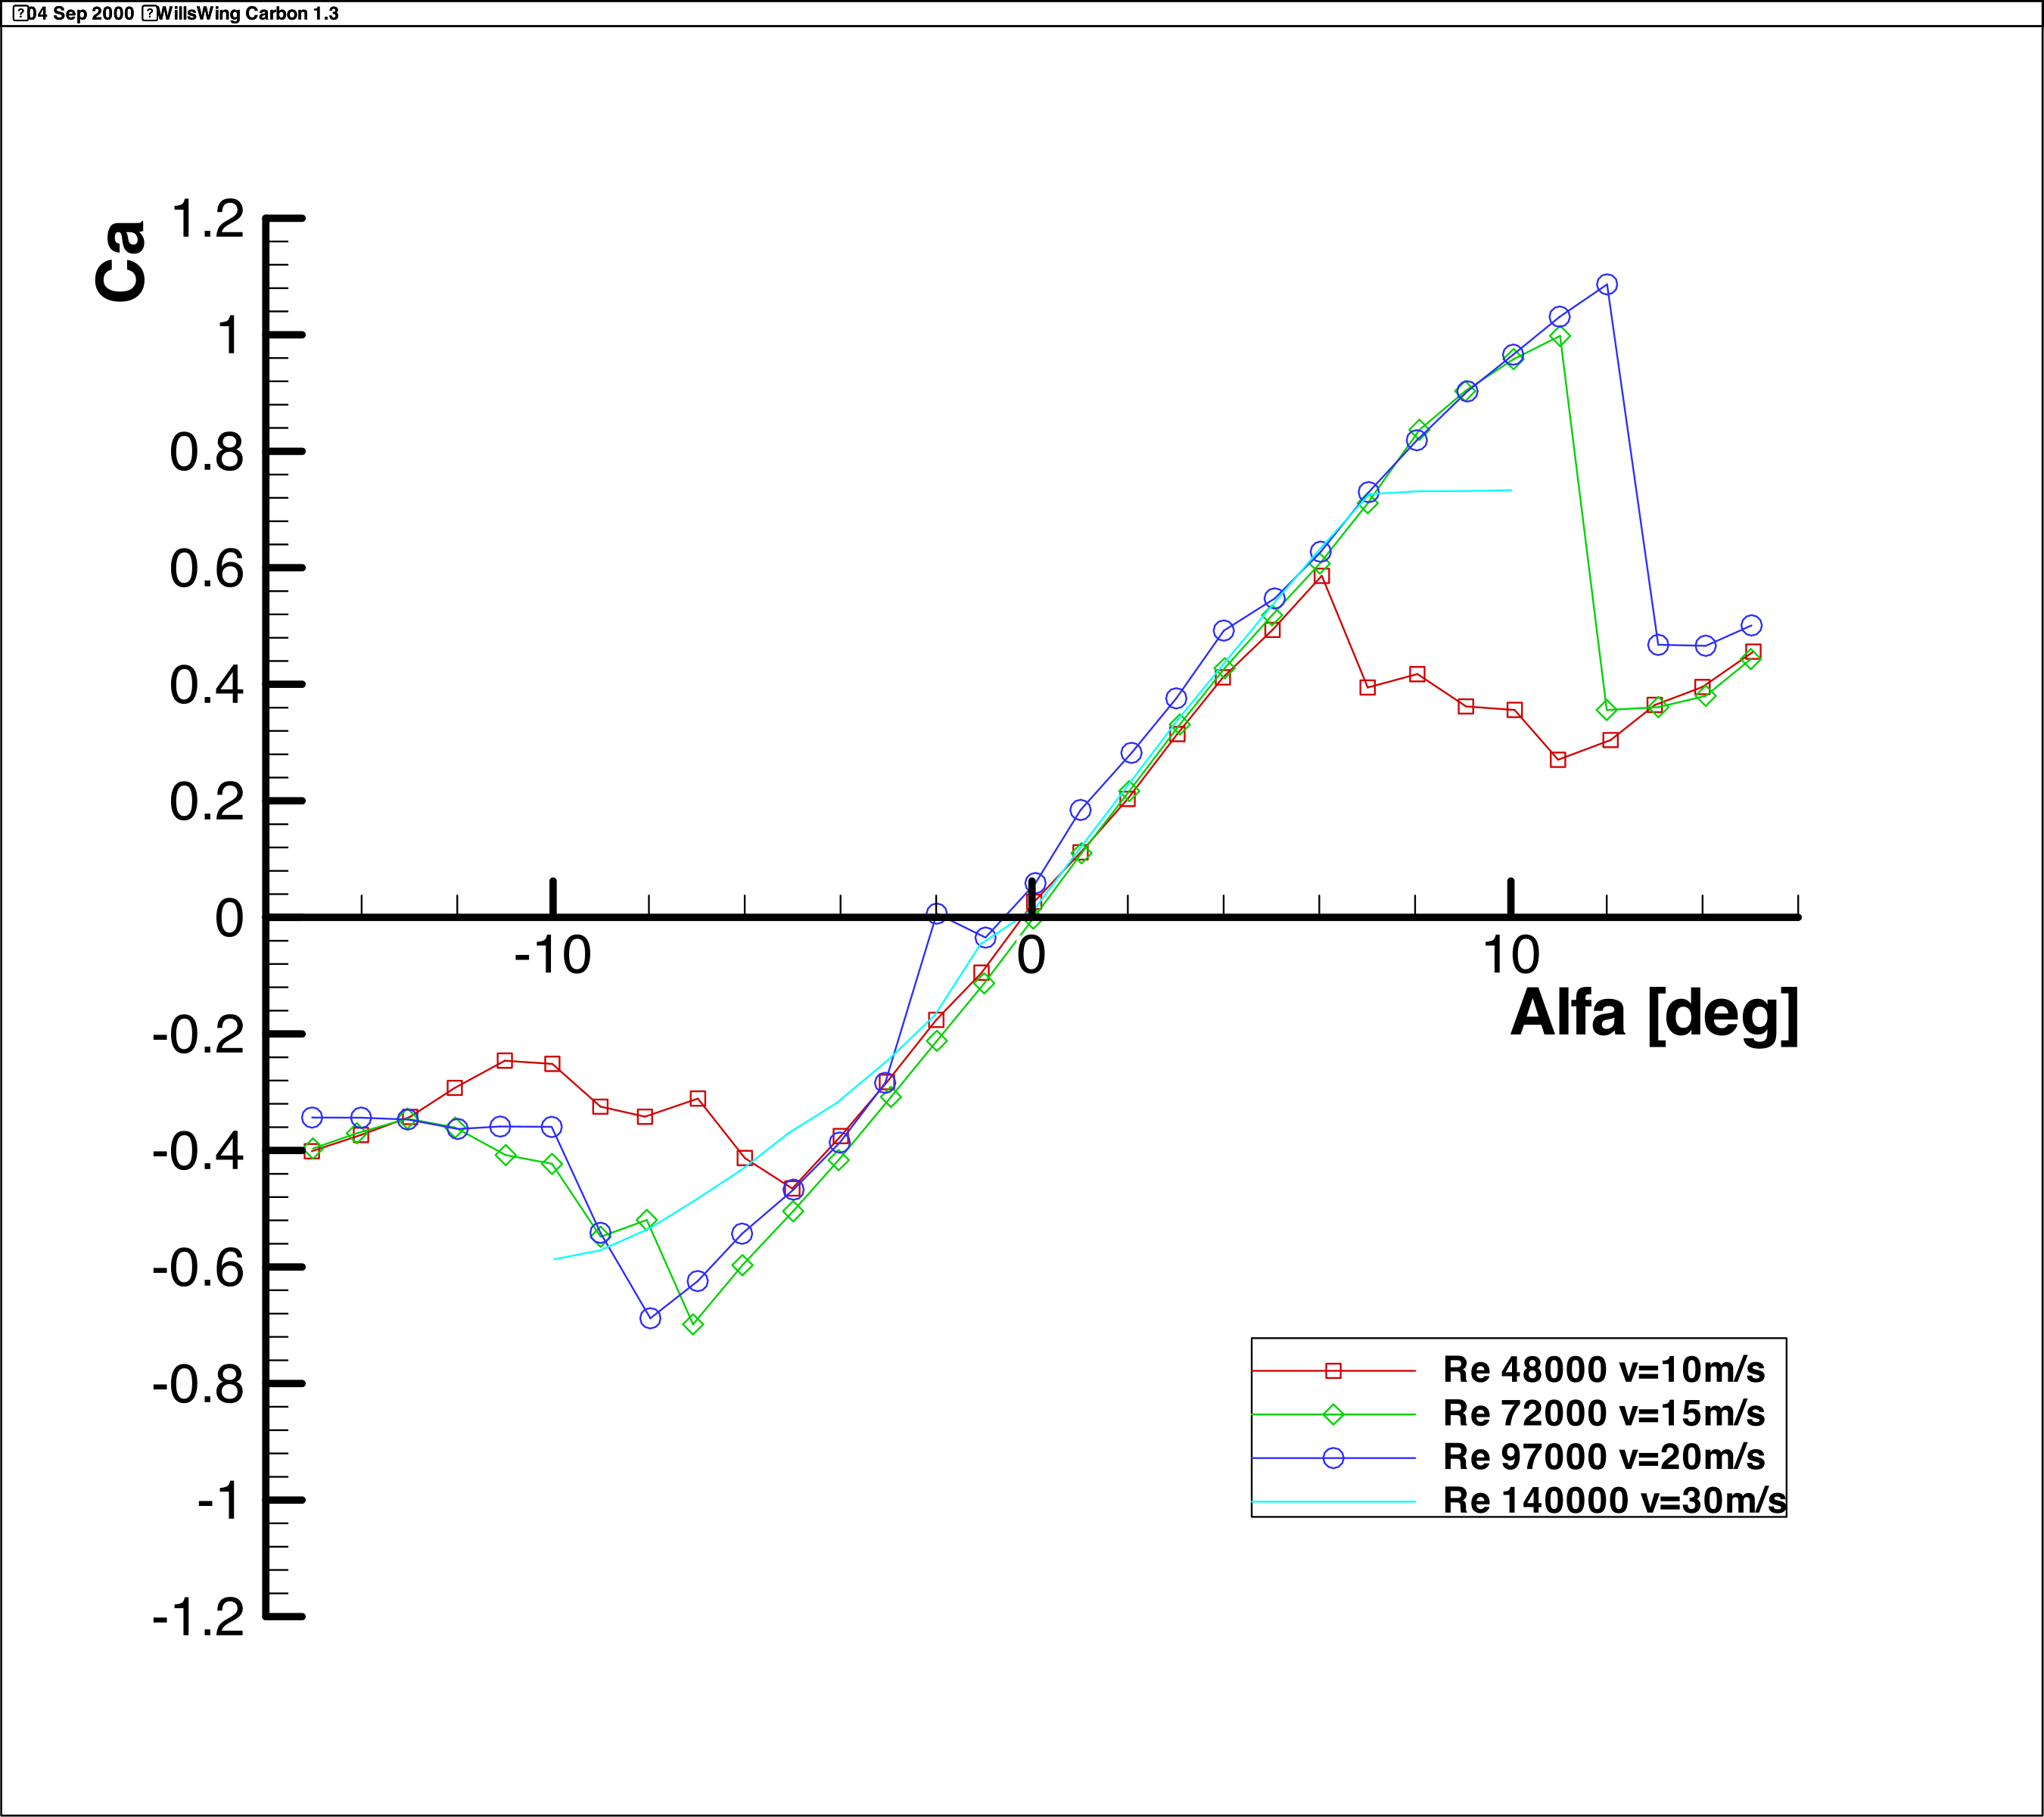
Figure 1.3-2: CL-α Diagram Wills Wing Carbon 1.3
1.4 Wills Wing Carbon, No Trip
Omitting the standard turbulator reduces the operational range of the profile to angles of attack of ±4 degrees at 20m/s; at lower speeds, separation is practically constant. The drag coefficients measured are in the range described under 1.1.
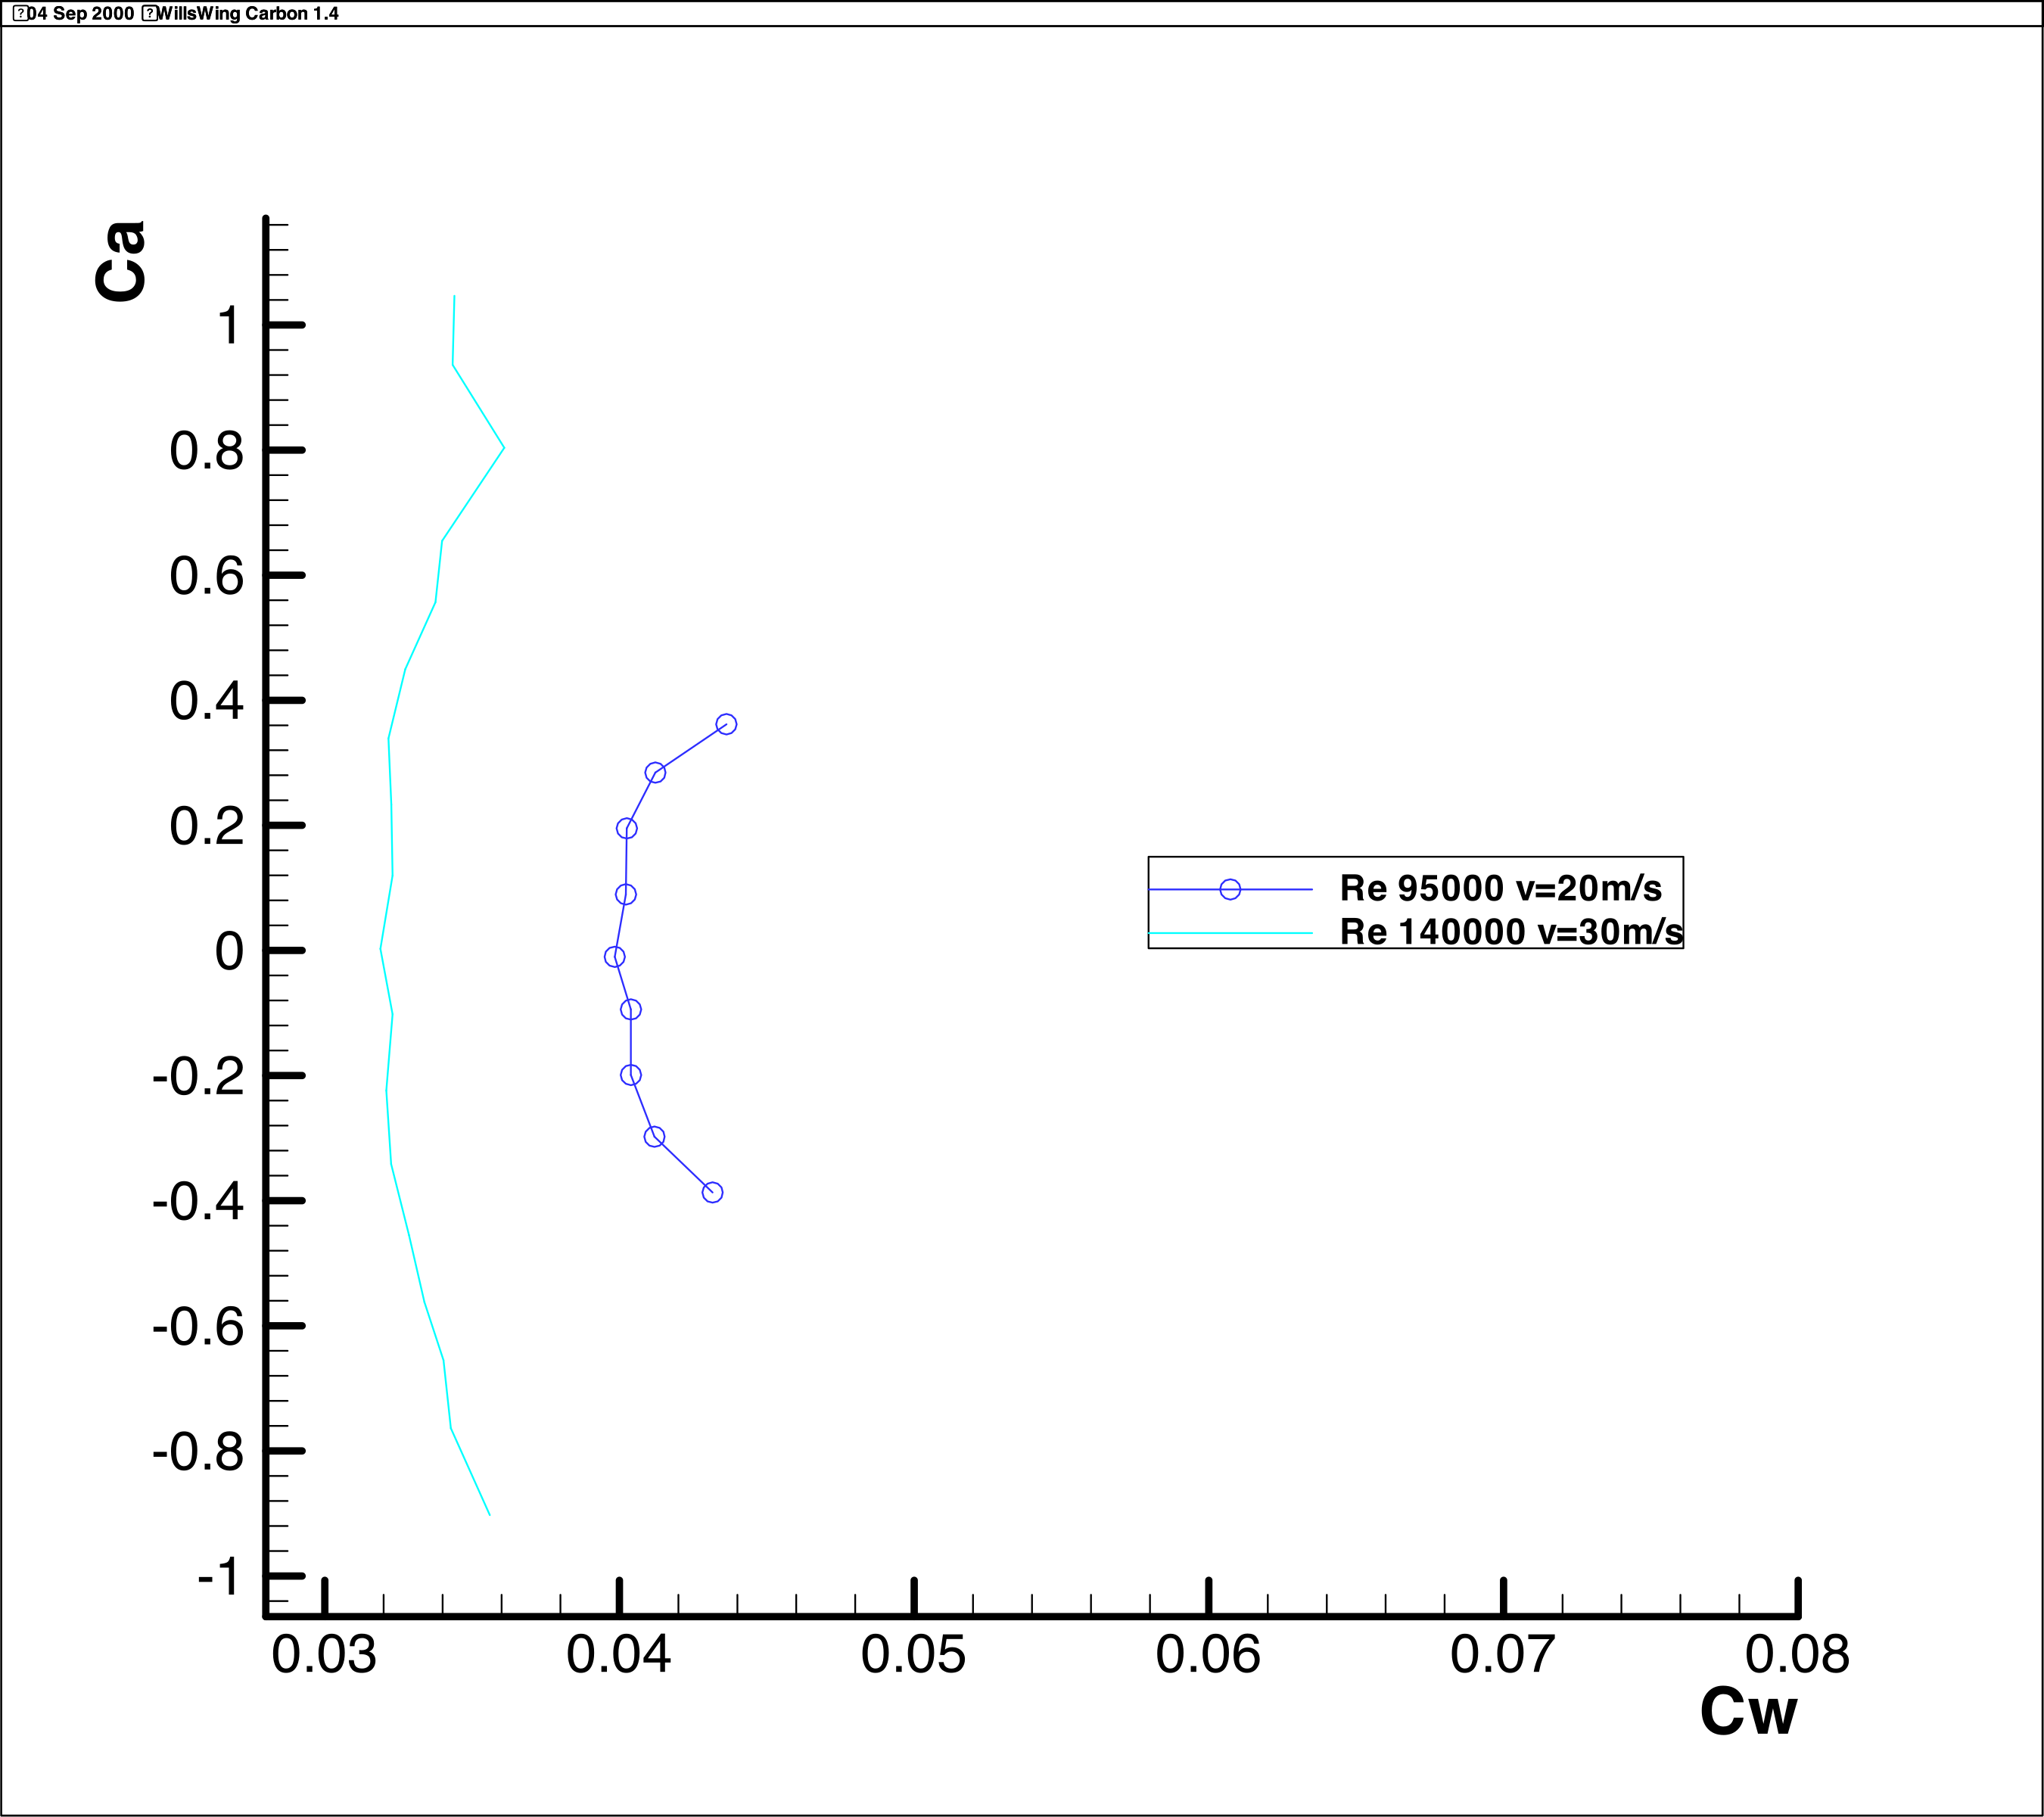
Figure 1.4-1: CL-CD Diagram Wills Wing Carbon 1.4
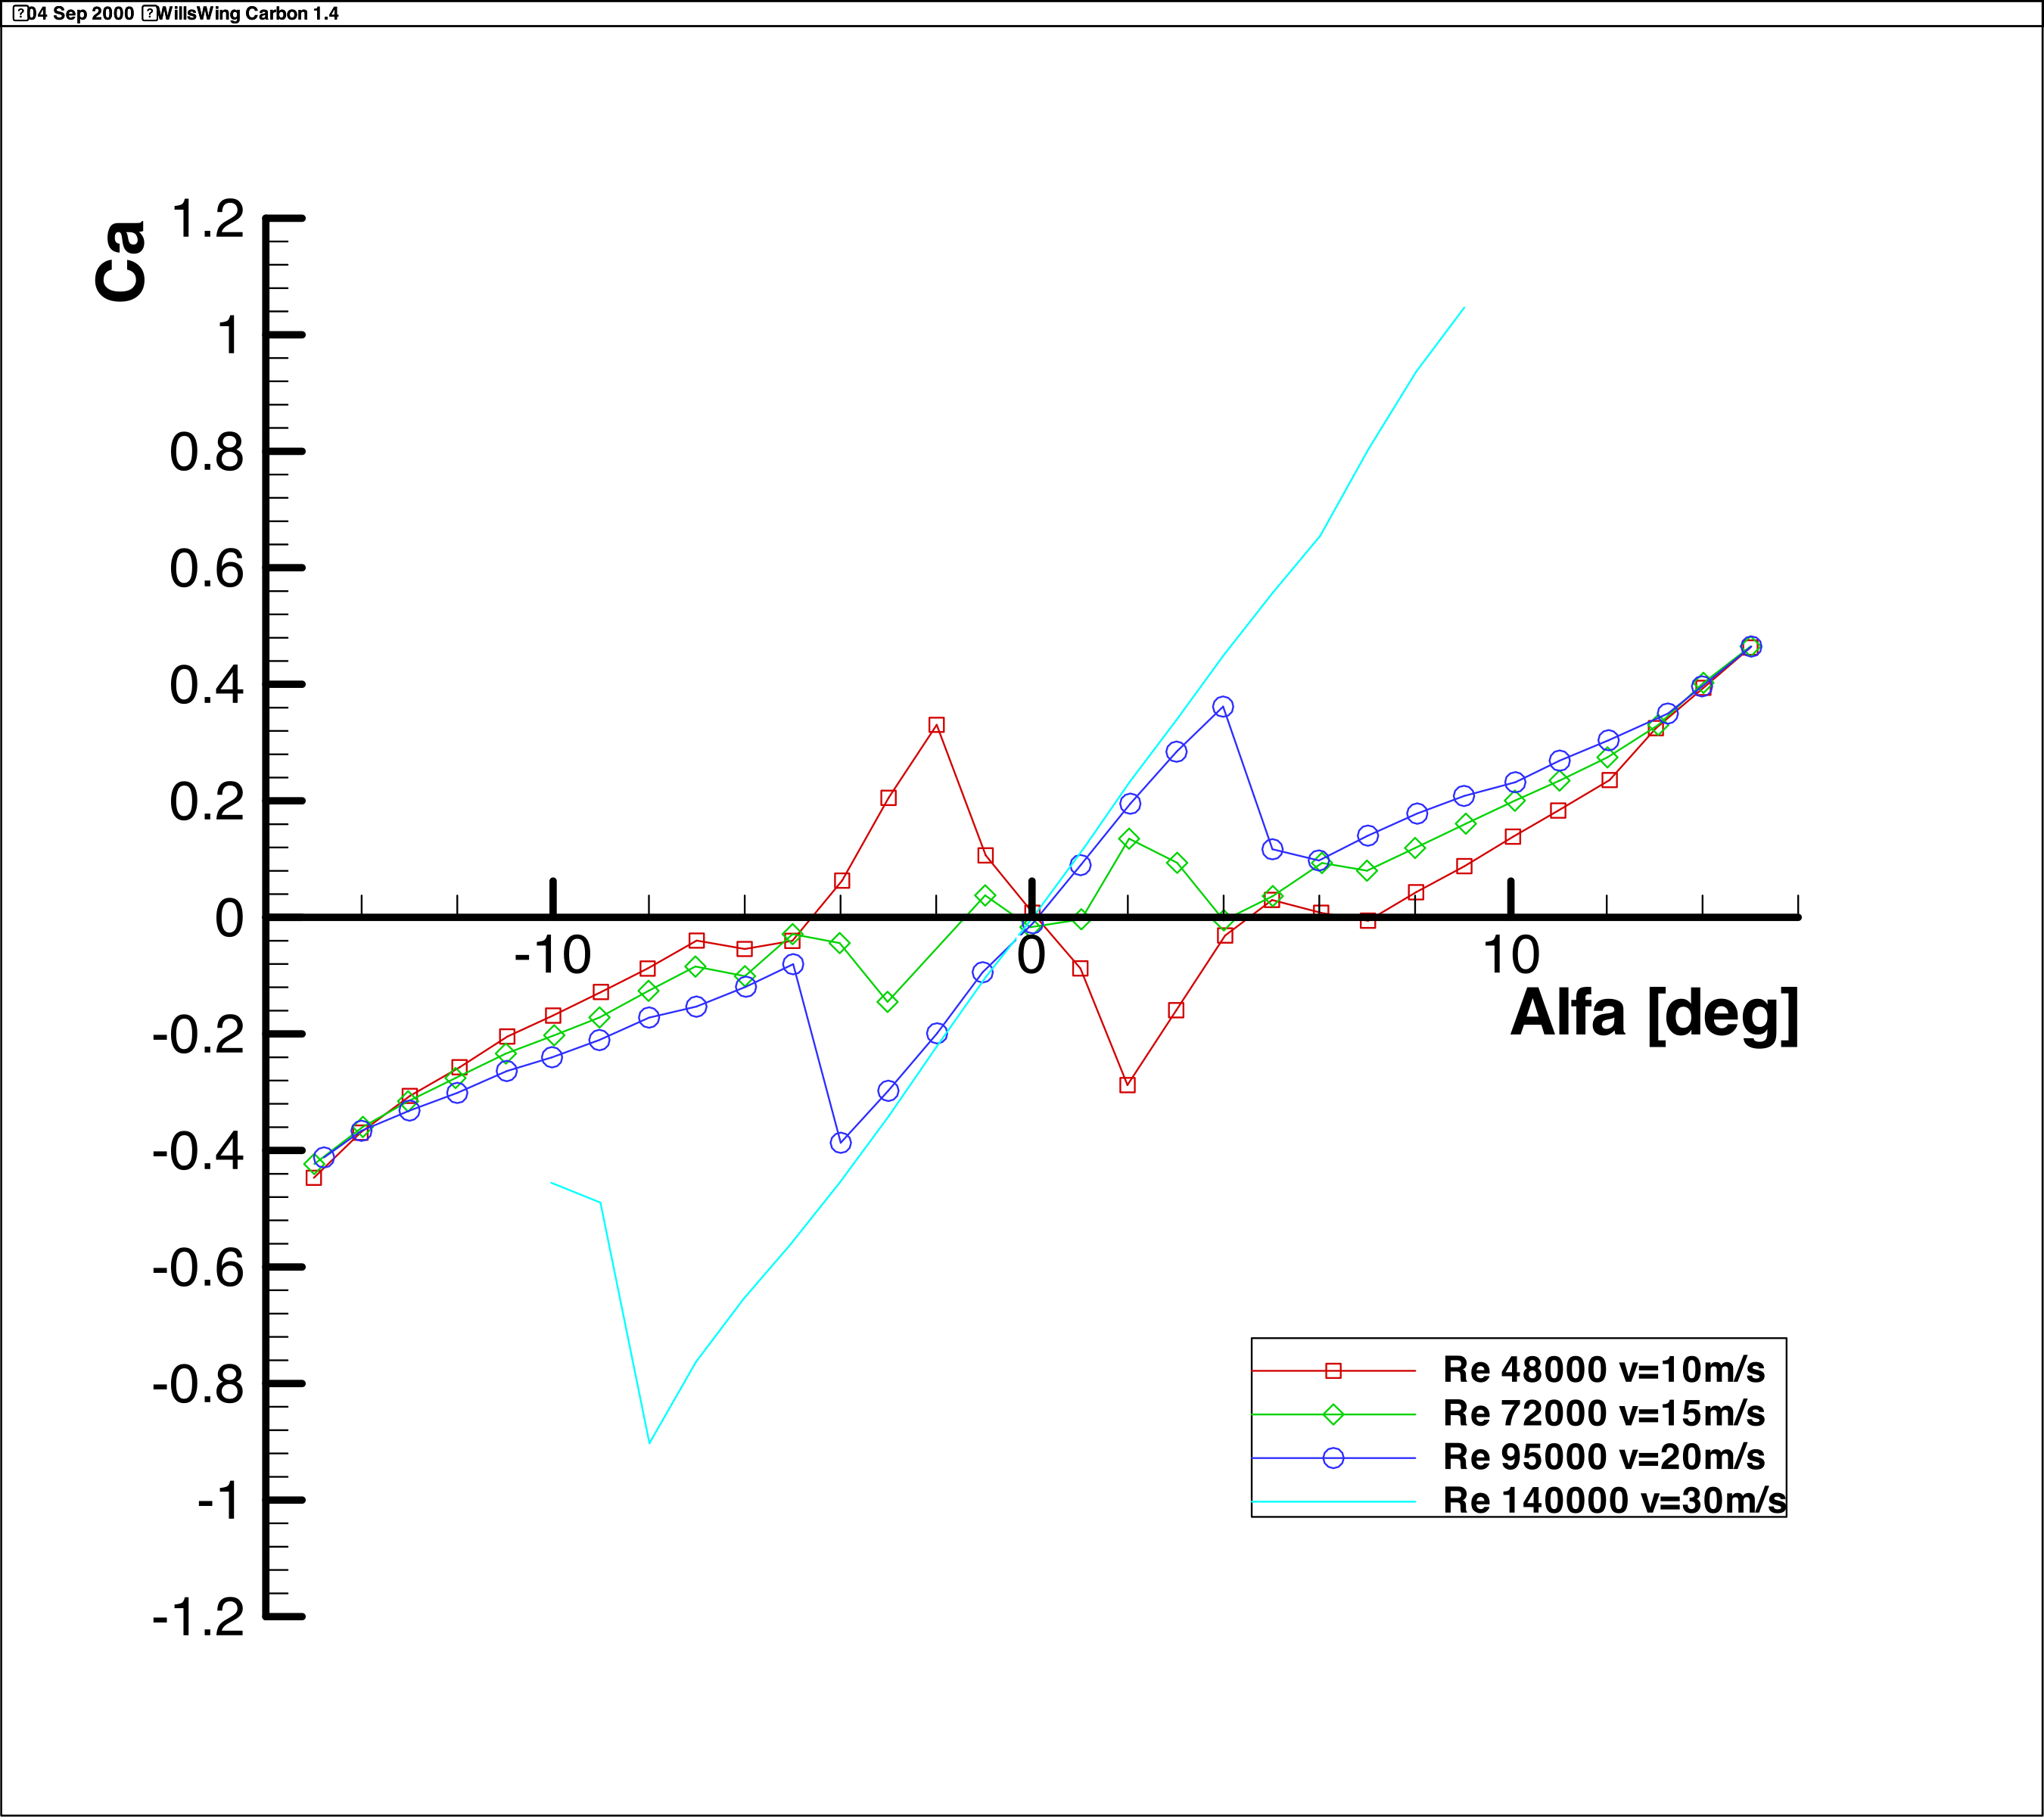
Figure 1.4-2: CL-α Diagram Wills Wing Carbon 1.4
2.1 Seedwing Aluminum Strut
Due to its relative thickness of 40.38%, separation occurs in the Seedwing at approximately ±5 degrees angle of attack; at a freestream velocity of 10m/s, this is consistently the case. Due to the large static pressure difference between the wake deficit and free freestream flow, no exact specification of the drag coefficient CD can be made at this speed. It should, however, be in the range of CD = 0.14 – 0.16.
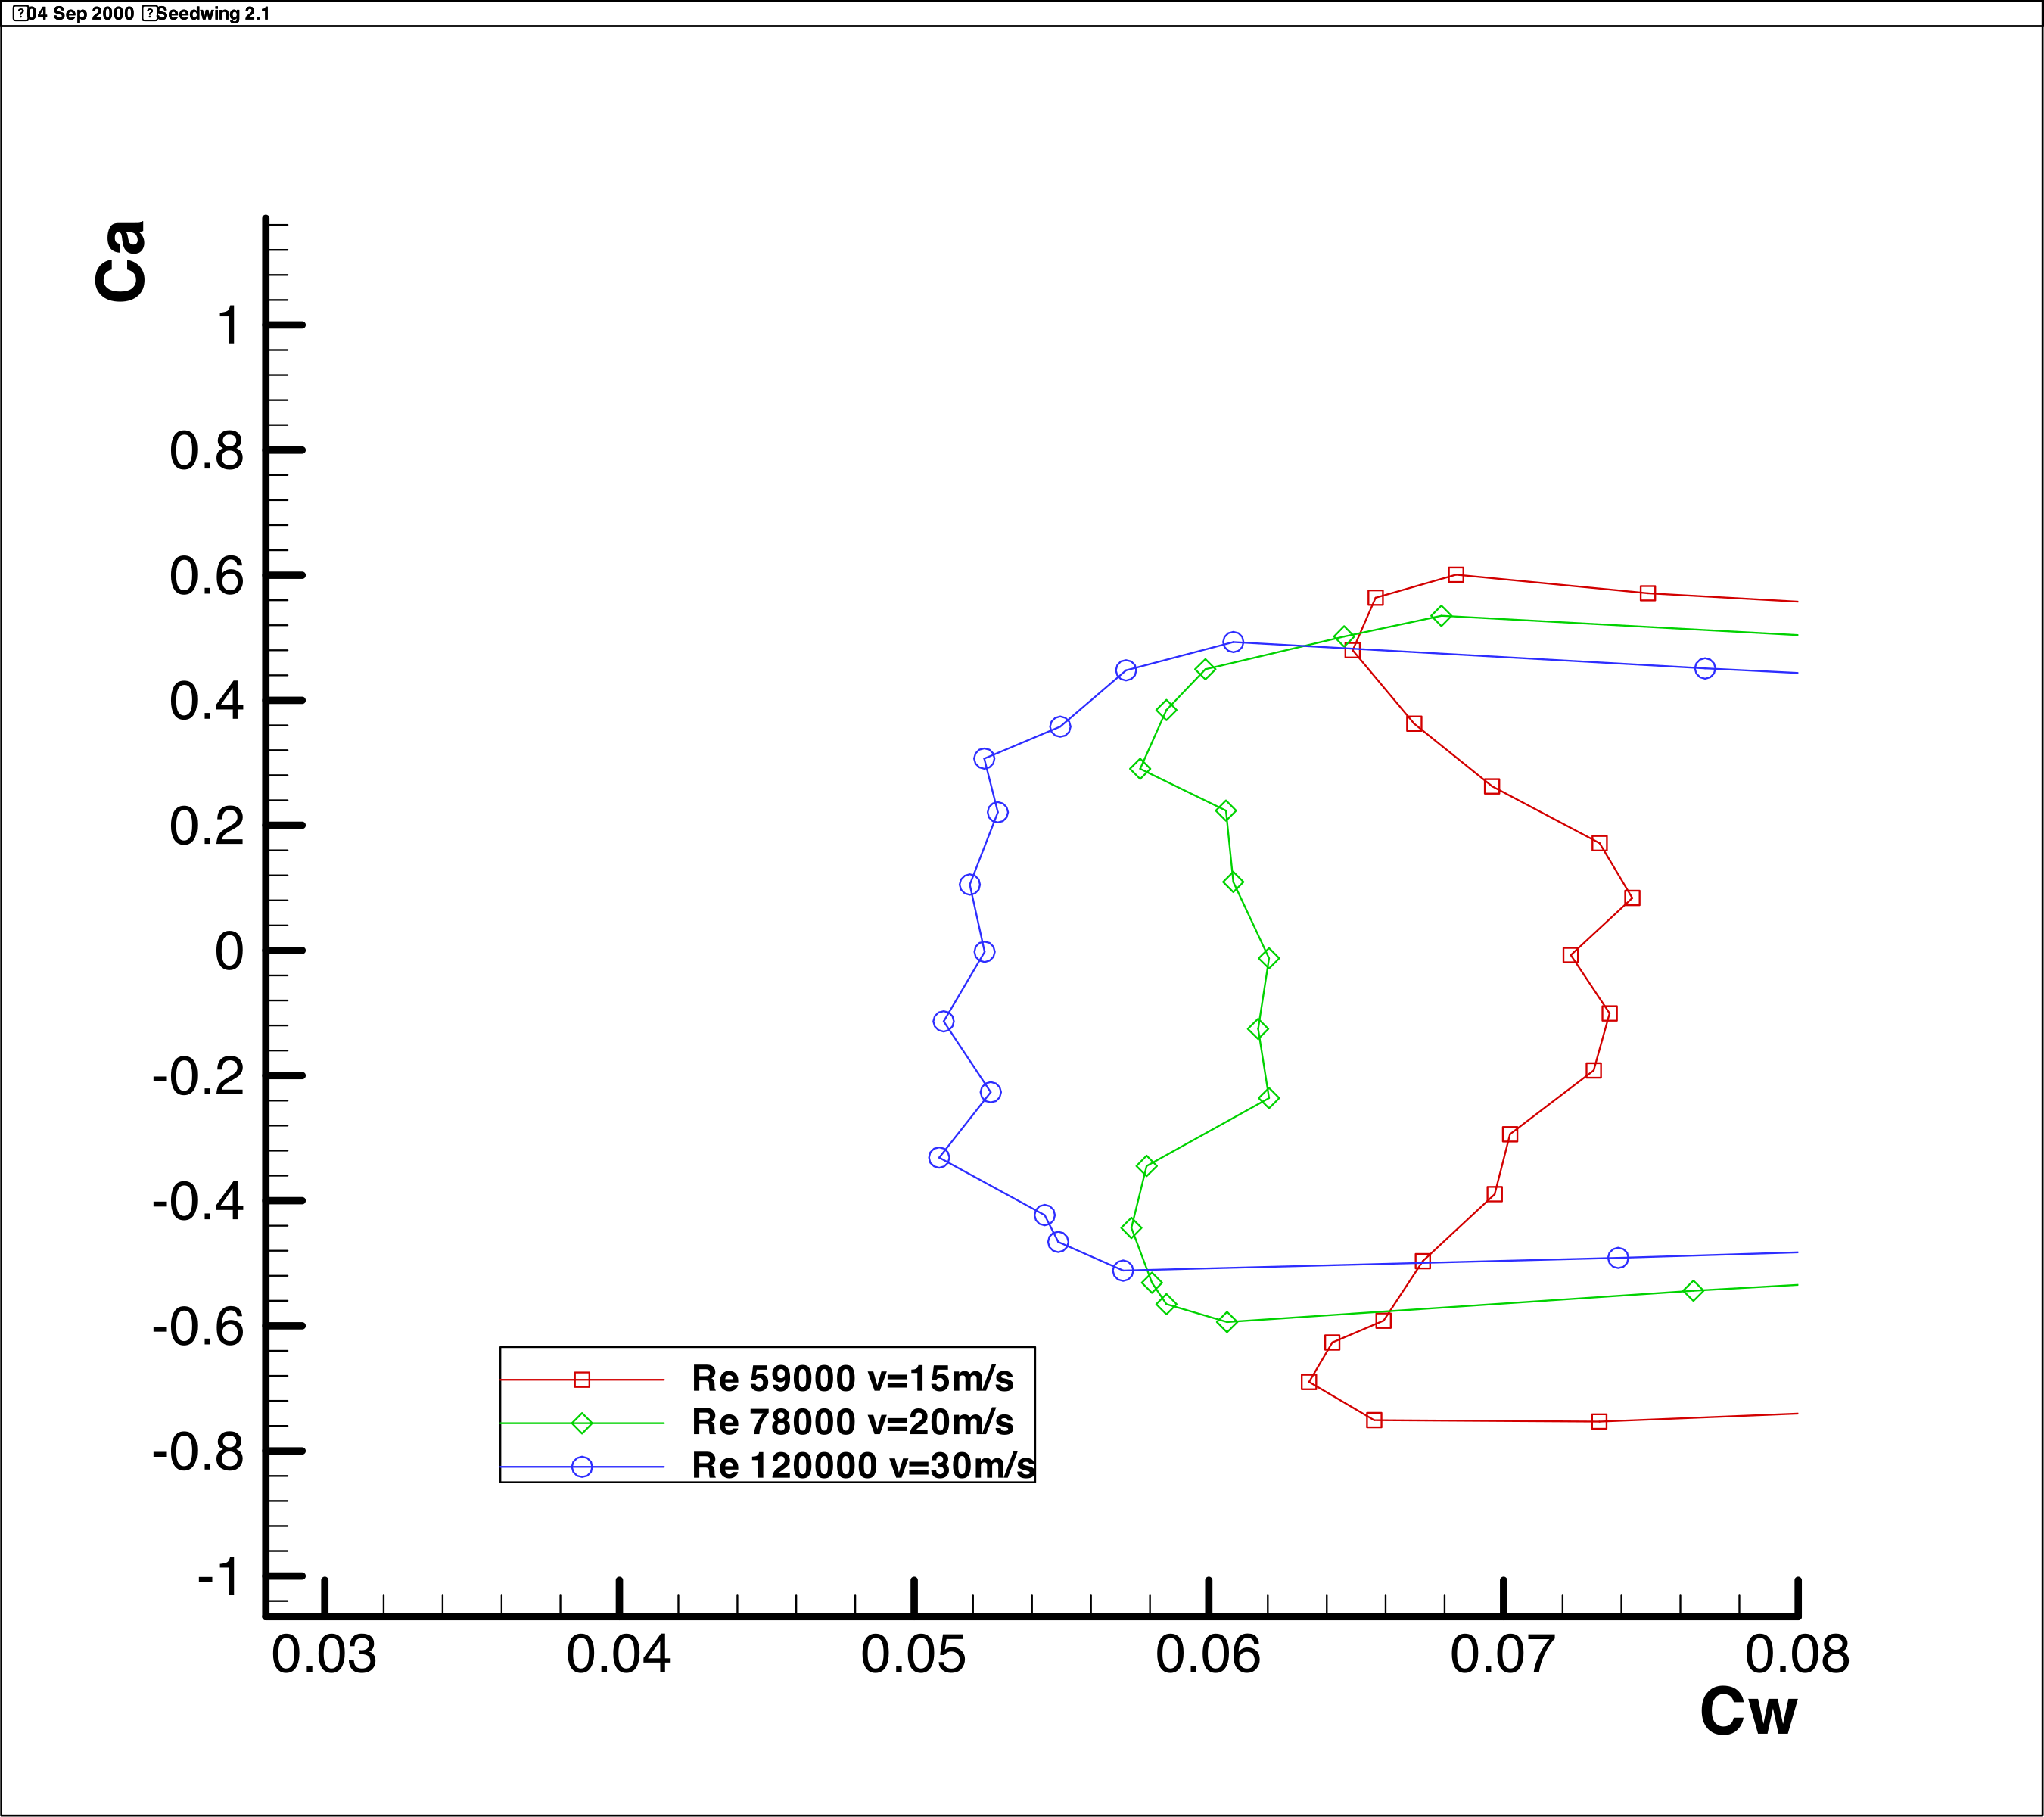
Figure 2.1-1: CL-CD Diagram Seedwing 2.1
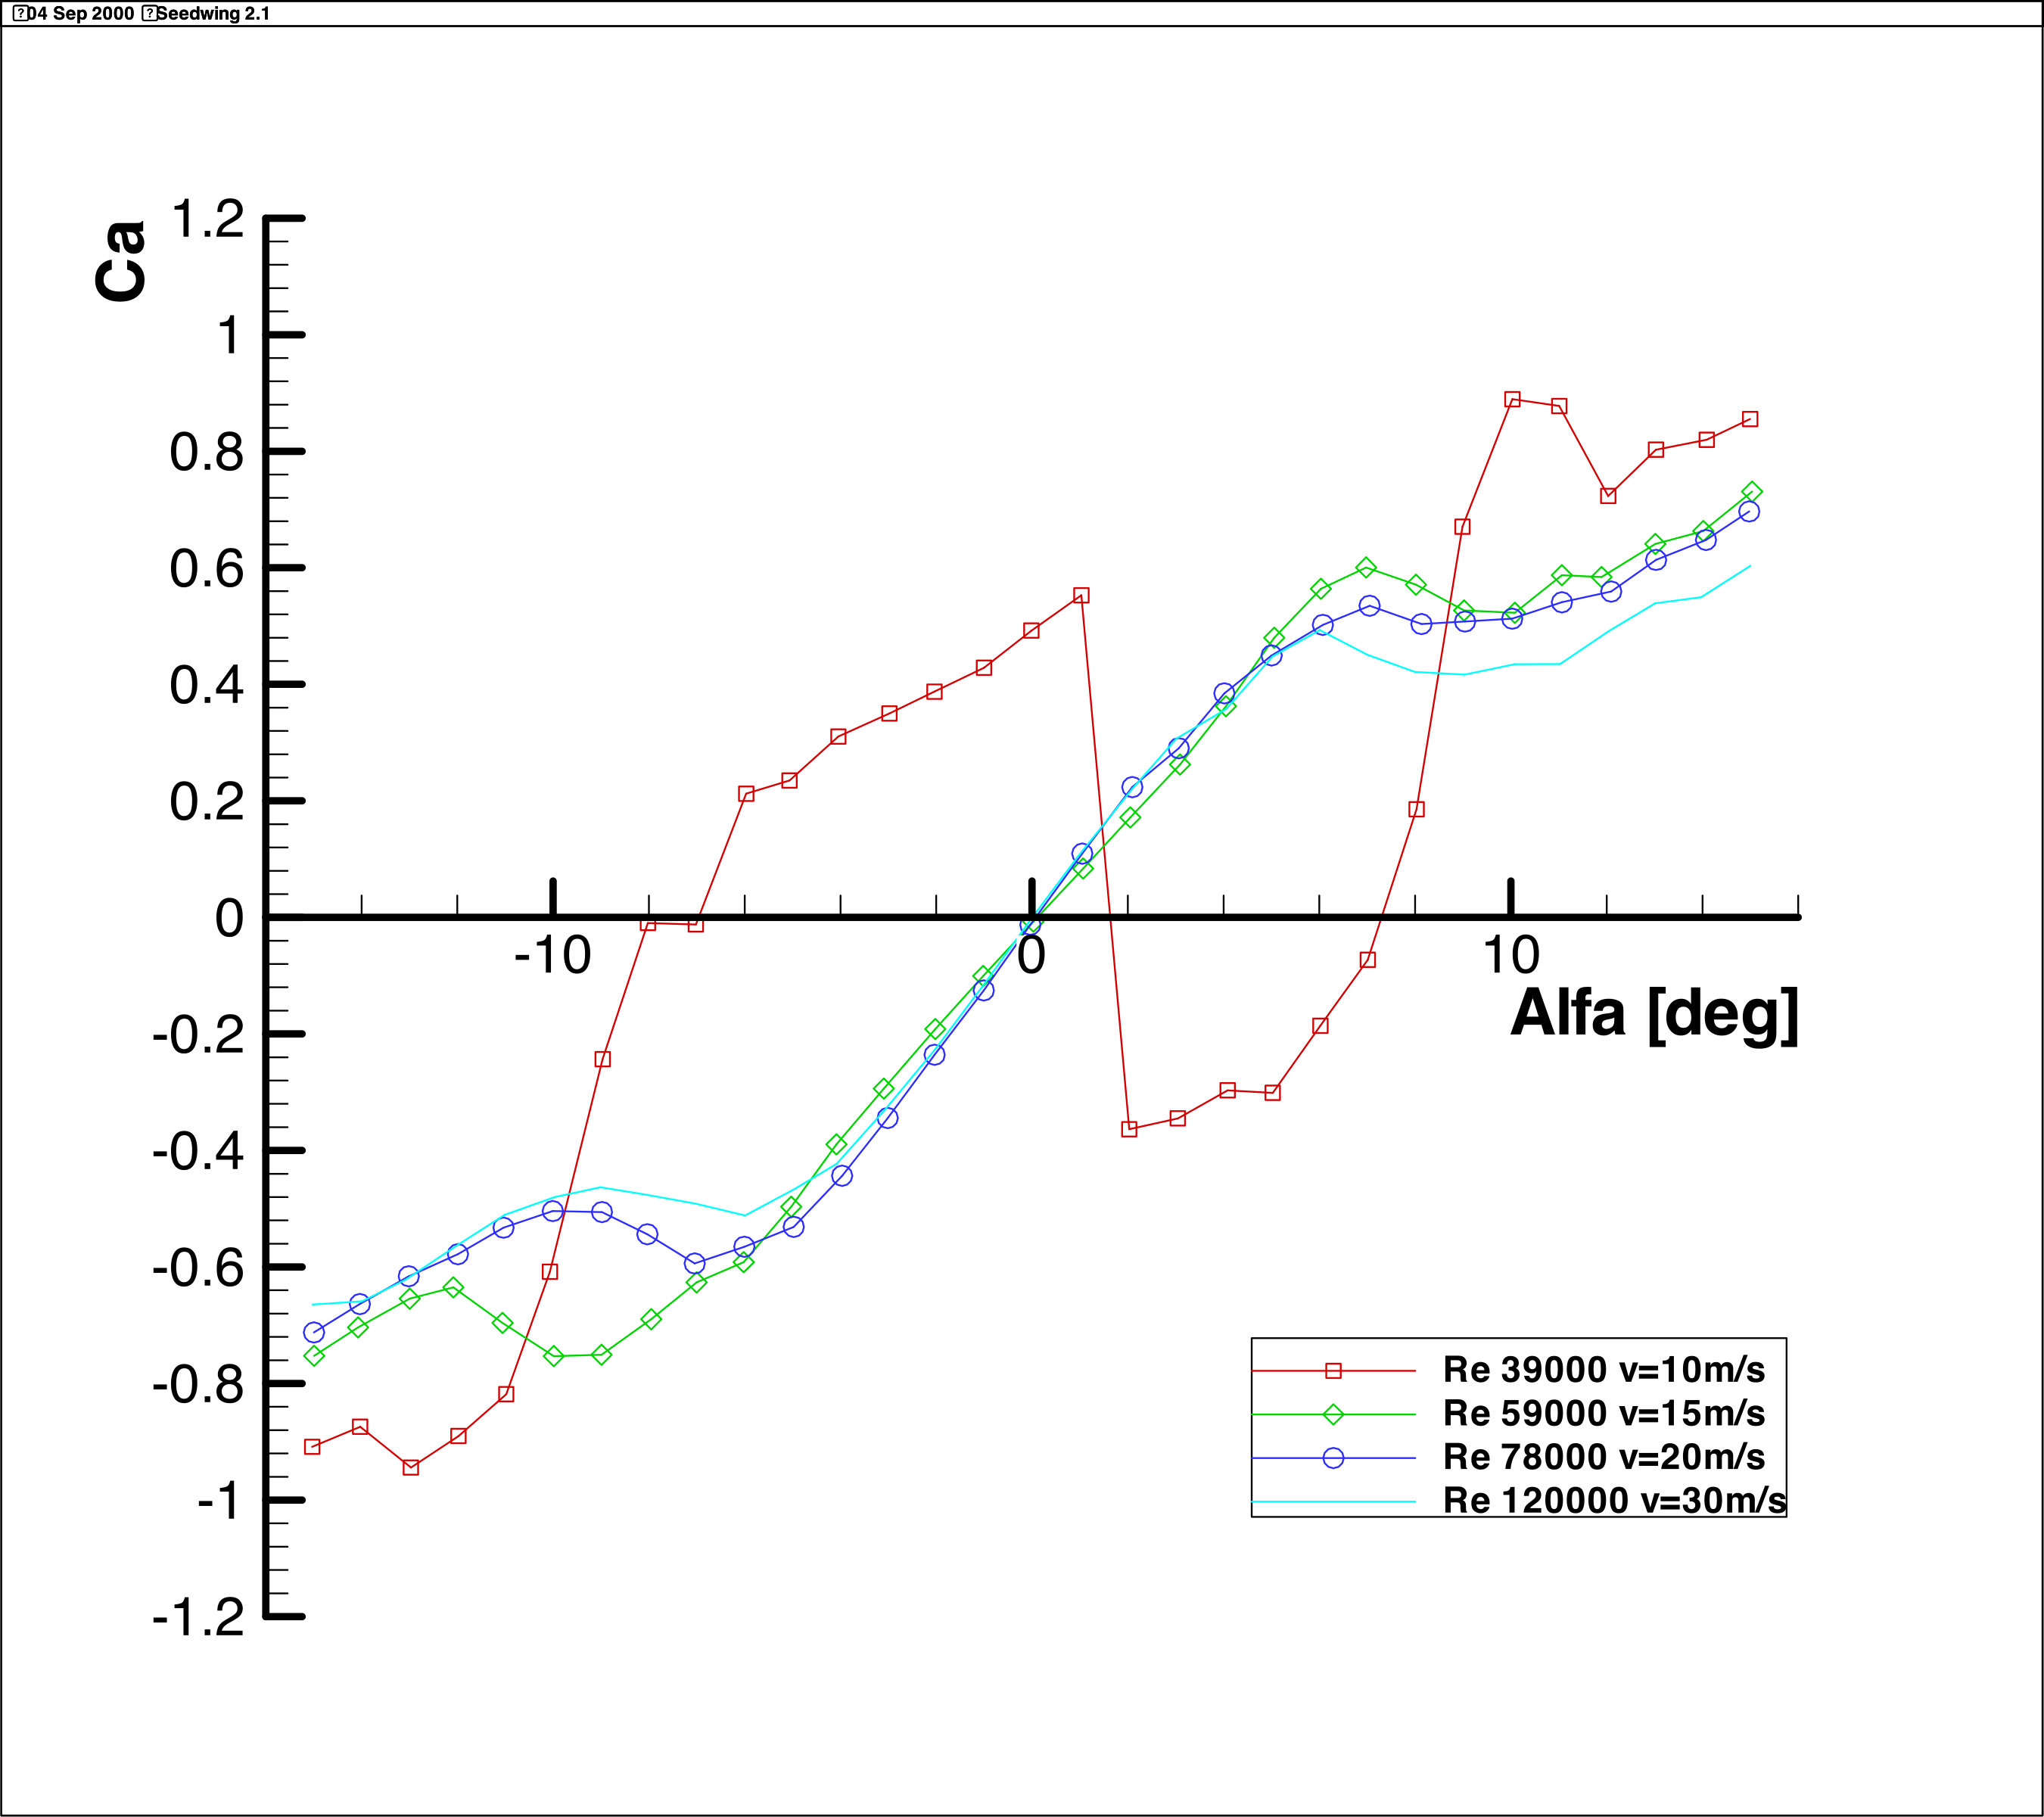
Figure 2.1-2: CL-α Diagram Seedwing 2.1
3.1 Aluminum Round Tube
A measurement of the circular cylinder was not possible with the given tunnel geometry since the static pressure of the free freestream flow only very slowly impresses itself on the wake. This led to very large static pressure differences even at rake distances of 10 times the chord length. Further displacement of the rake was not possible due to the length of the measurement chamber. The measured drag coefficients ranged from 0.75 to 0.81 depending on speed and were thus significantly below the value given in literature of approximately 1.01 to 1.03.
3.2 Aluminum Round Tube with Turbulator
Due to the poor measurement results under 3.1, an investigation of the circular cylinder with turbulator was omitted, since the change in the drag coefficient rather than the change in the transition point was to be investigated.
4.1 Finsterwalder Aluminum Strut
This very thick strut profile with 52.64% relative thickness was practically in the separated state during the entire measured range. Flow separation could be detected with tuft visualization in a range of approximately 39% – 42% chord length. The position of separation was nearly constant over the entire α range (±15 degrees).
Due to the large static pressure difference caused by the separation, the exact drag coefficient cannot be specified for this profile. It should, however, move in the following orders of magnitude:
- Freestream velocity 10m/s → approximately CD = 0.28 – 0.35
- Freestream velocity 15m/s → approximately CD = 0.28 – 0.35
- Freestream velocity 20m/s → approximately CD = 0.27 – 0.34
- Freestream velocity 30m/s → approximately CD = 0.11 – 0.20
The shape of the drag polar can be approximately determined from the geometry of the CL-α polar, since every abrupt change in lift coefficient is associated with a strong increase in drag.
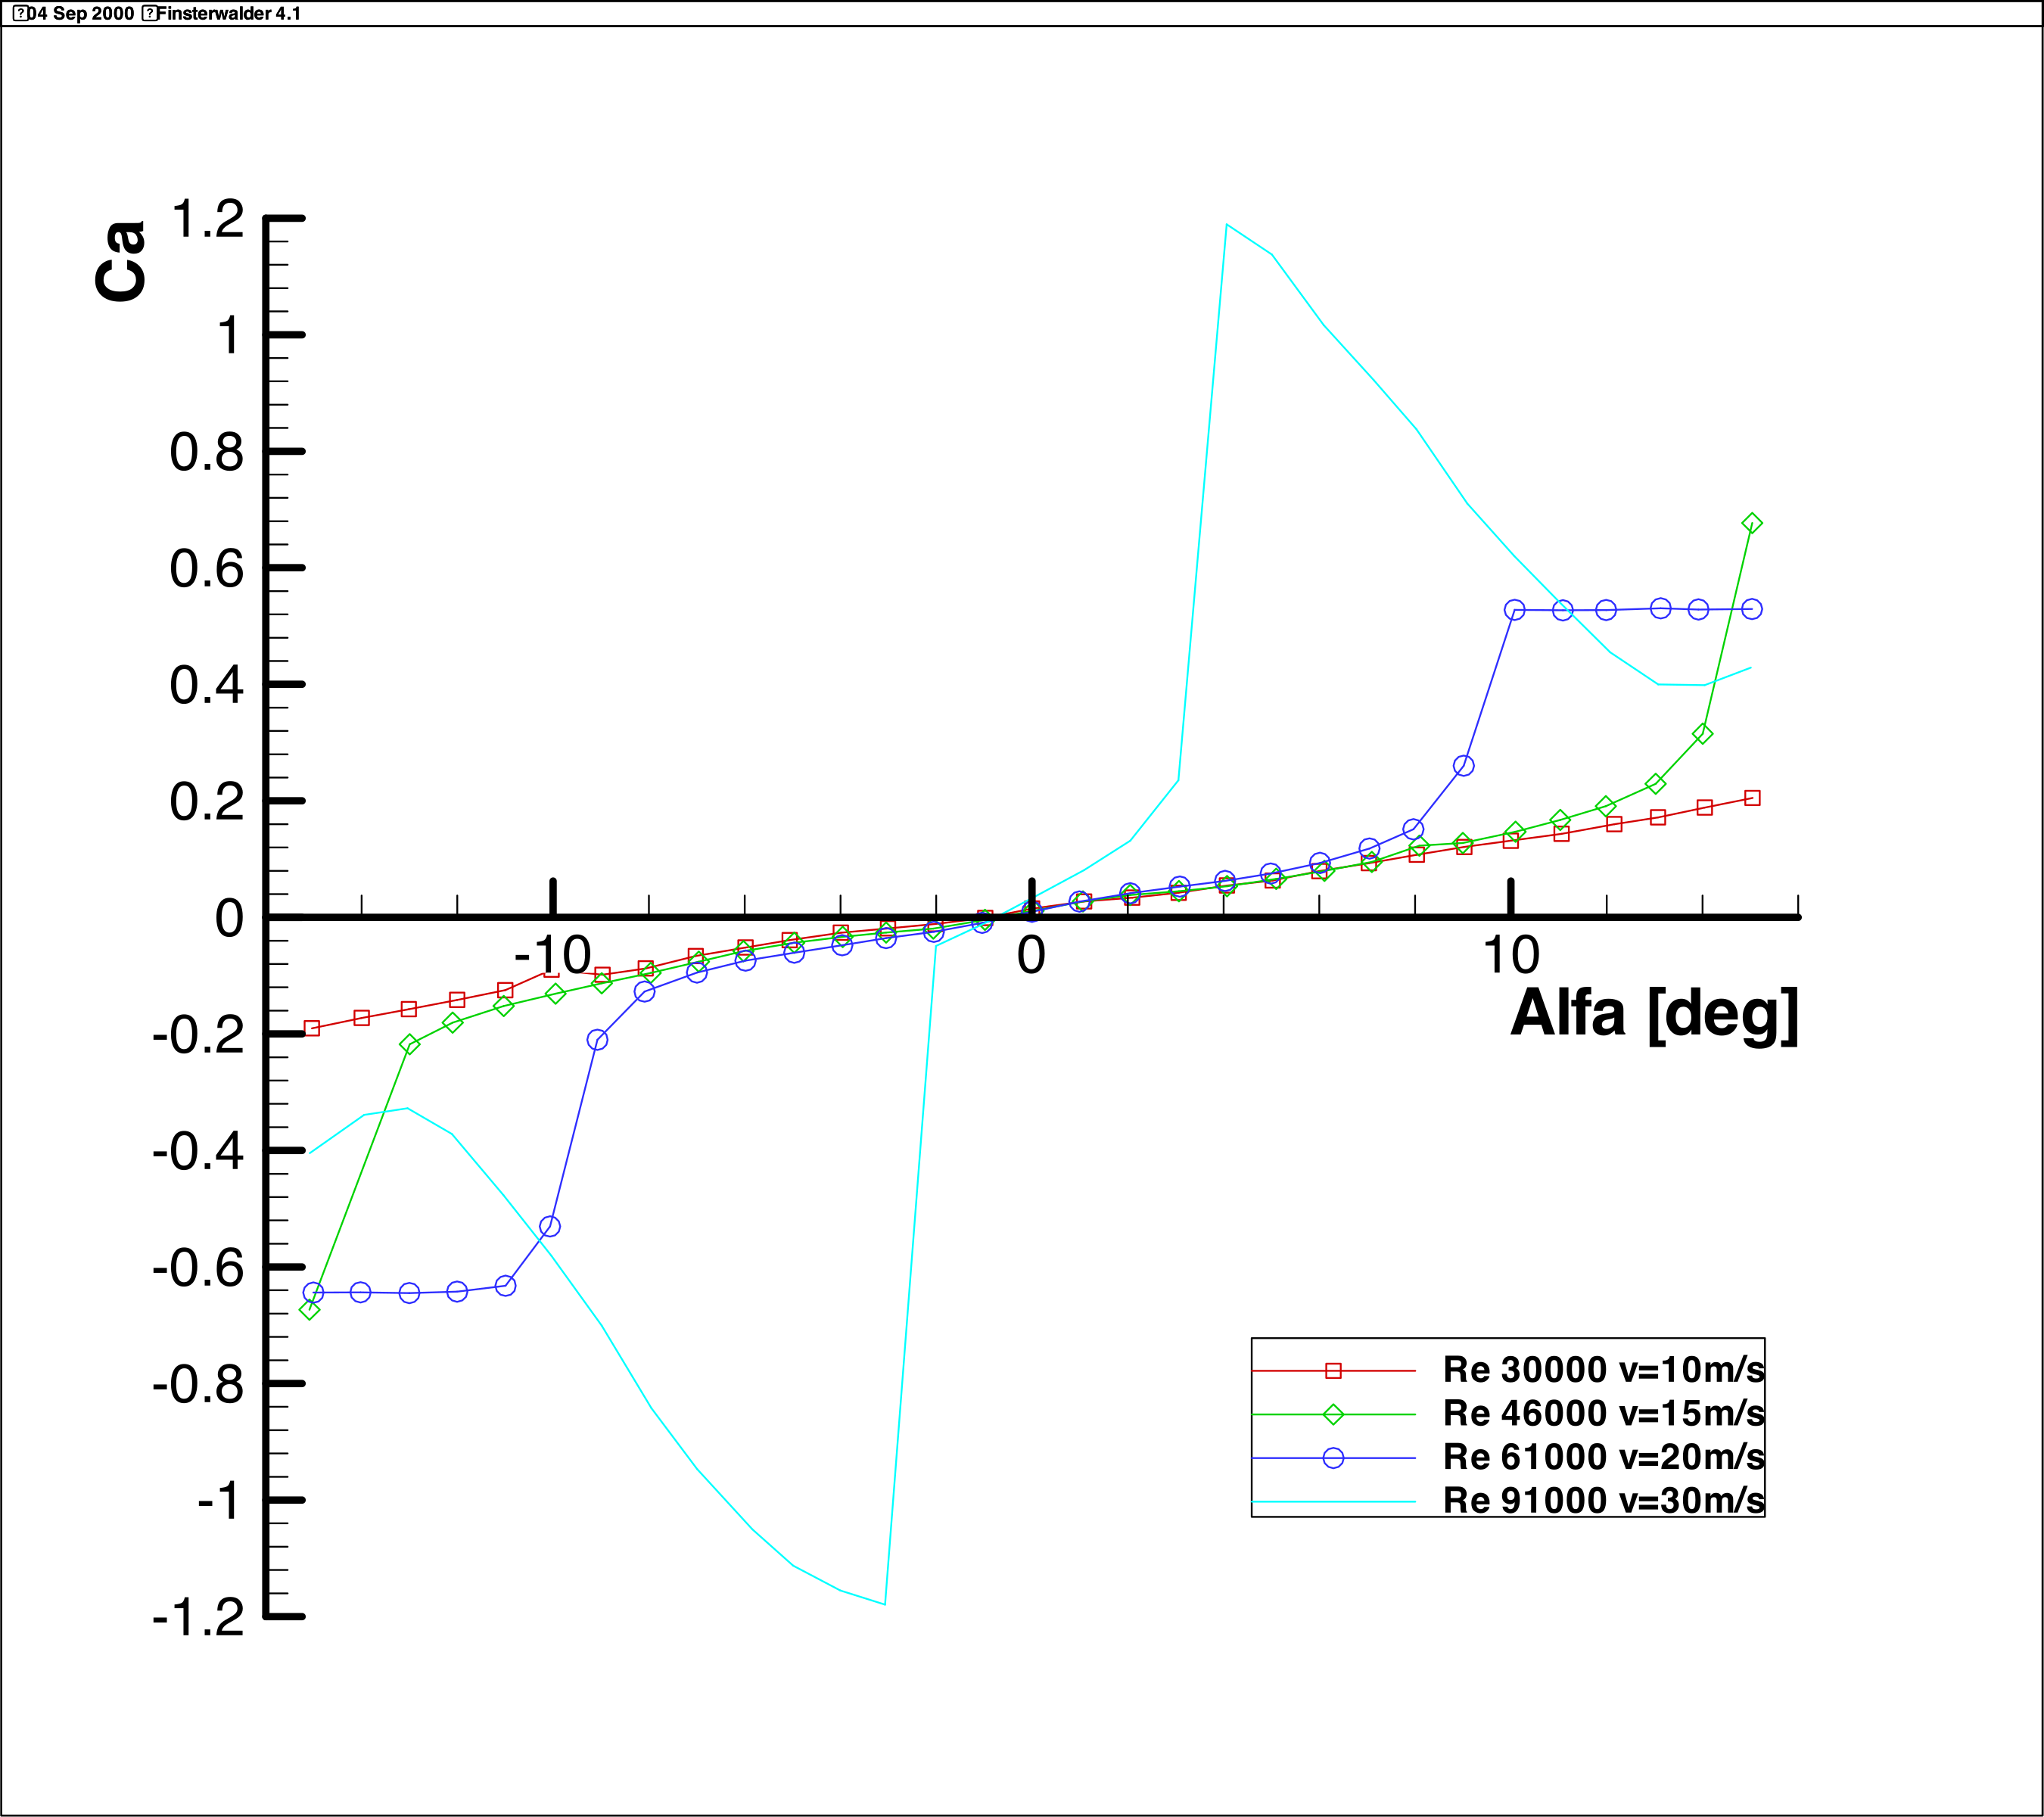
Figure 4.1-2: CL-α Diagram Finsterwalder 4.1
4.2 Wills Wing Standard Aluminum Strut
This strut profile, also very thick at 51.88%, was like the Finsterwalder profile investigated under 4.1 constantly in the separated range during the complete investigation.
Due to the large static pressure difference caused by separation, the exact drag coefficient cannot be specified for this profile either. It should, however, move in the following orders of magnitude:
- Freestream velocity 10m/s → approximately CD = 0.28 – 0.35
- Freestream velocity 15m/s → approximately CD = 0.18 – 0.25
- Freestream velocity 20m/s → approximately CD = 0.13 – 0.20
- Freestream velocity 30m/s → approximately CD = 0.08 – 0.12
The shape of the drag polar can also be approximately determined here from the geometry of the CL-α polar, since every abrupt change in lift coefficient is associated with a strong increase in drag. Notable in this profile is the tendency to separate abruptly on the side with higher angle of attack with only slight increases in angle of attack. This effect occurred mainly at higher speeds.
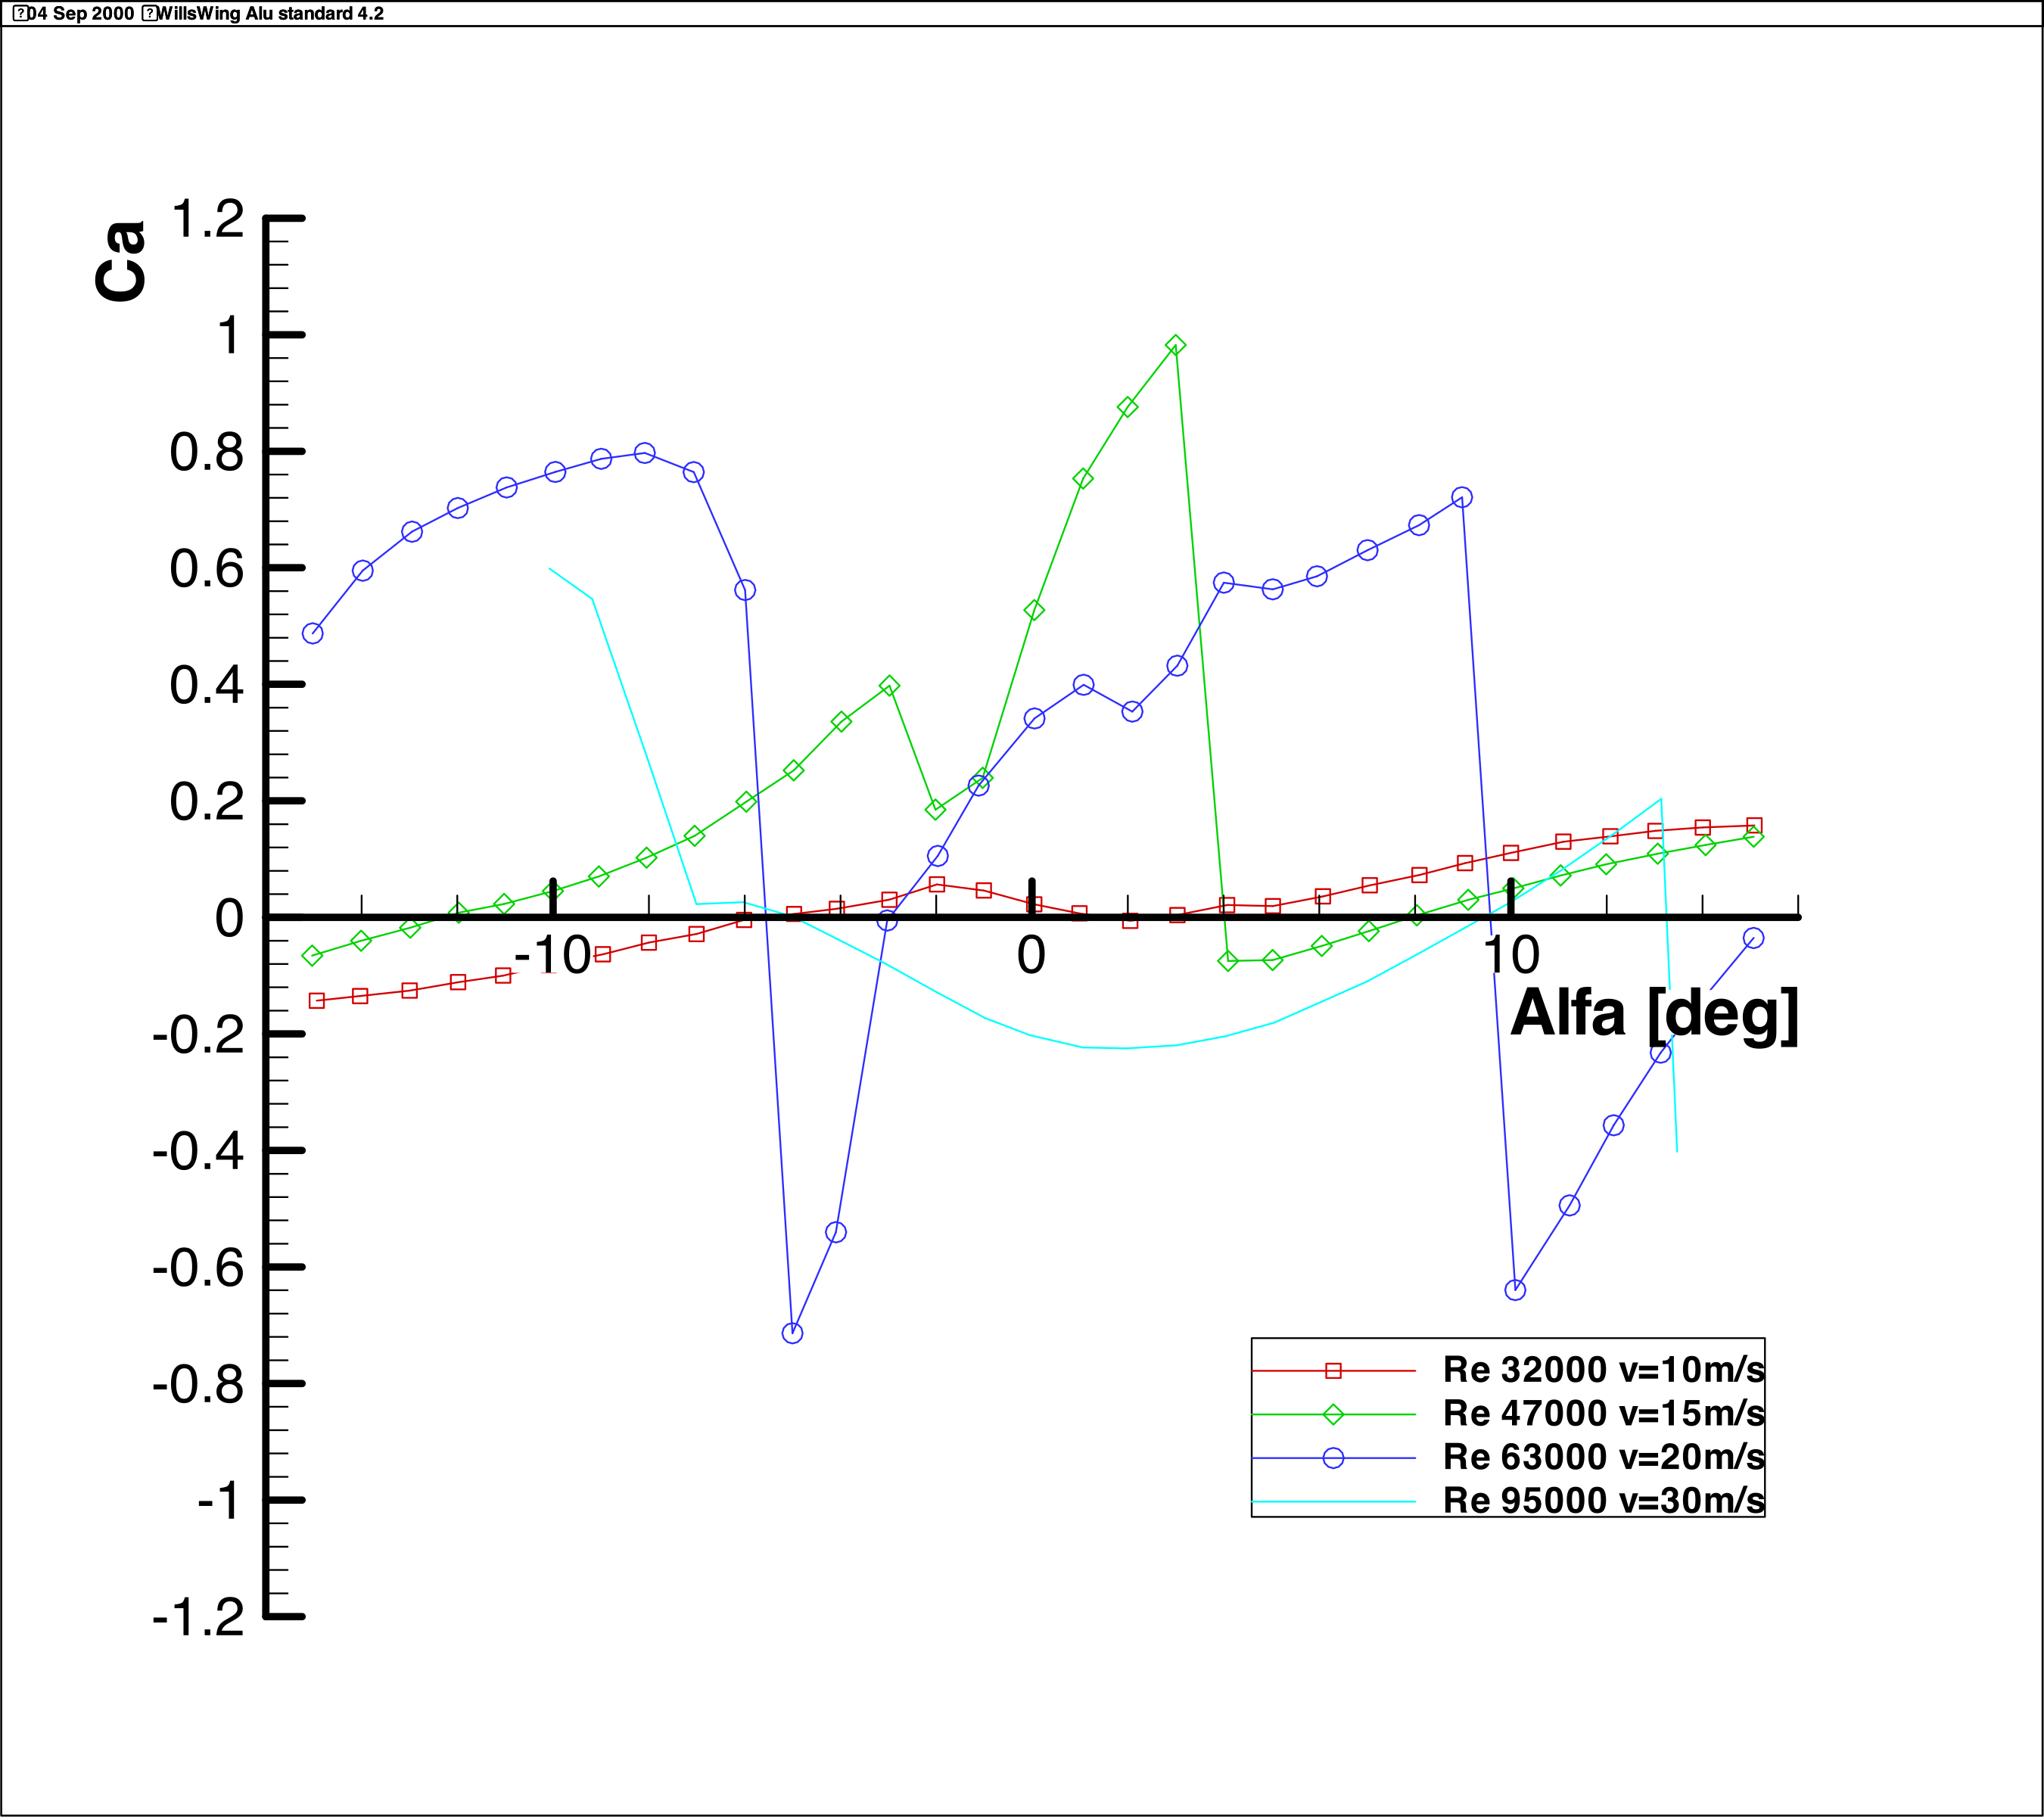
Figure 4.2-2: CL-α Diagram Wills Wing Standard 4.2
5.1 Wills Wing Aluminum Profile
The most essential difference of this model from the carbon profile from 1.1 is the turbulator placed quite far forward at 10% chord length, extruded in one piece with the profile. This extends the angle of attack range of the profile to a good ±10 degrees with approximately constant drag coefficient. Whether the waves in the rear half created by production and transport influence the properties of the profile was not investigated. After turbulent separation, the drag increases by a factor of 4 – 5 relative to CD.
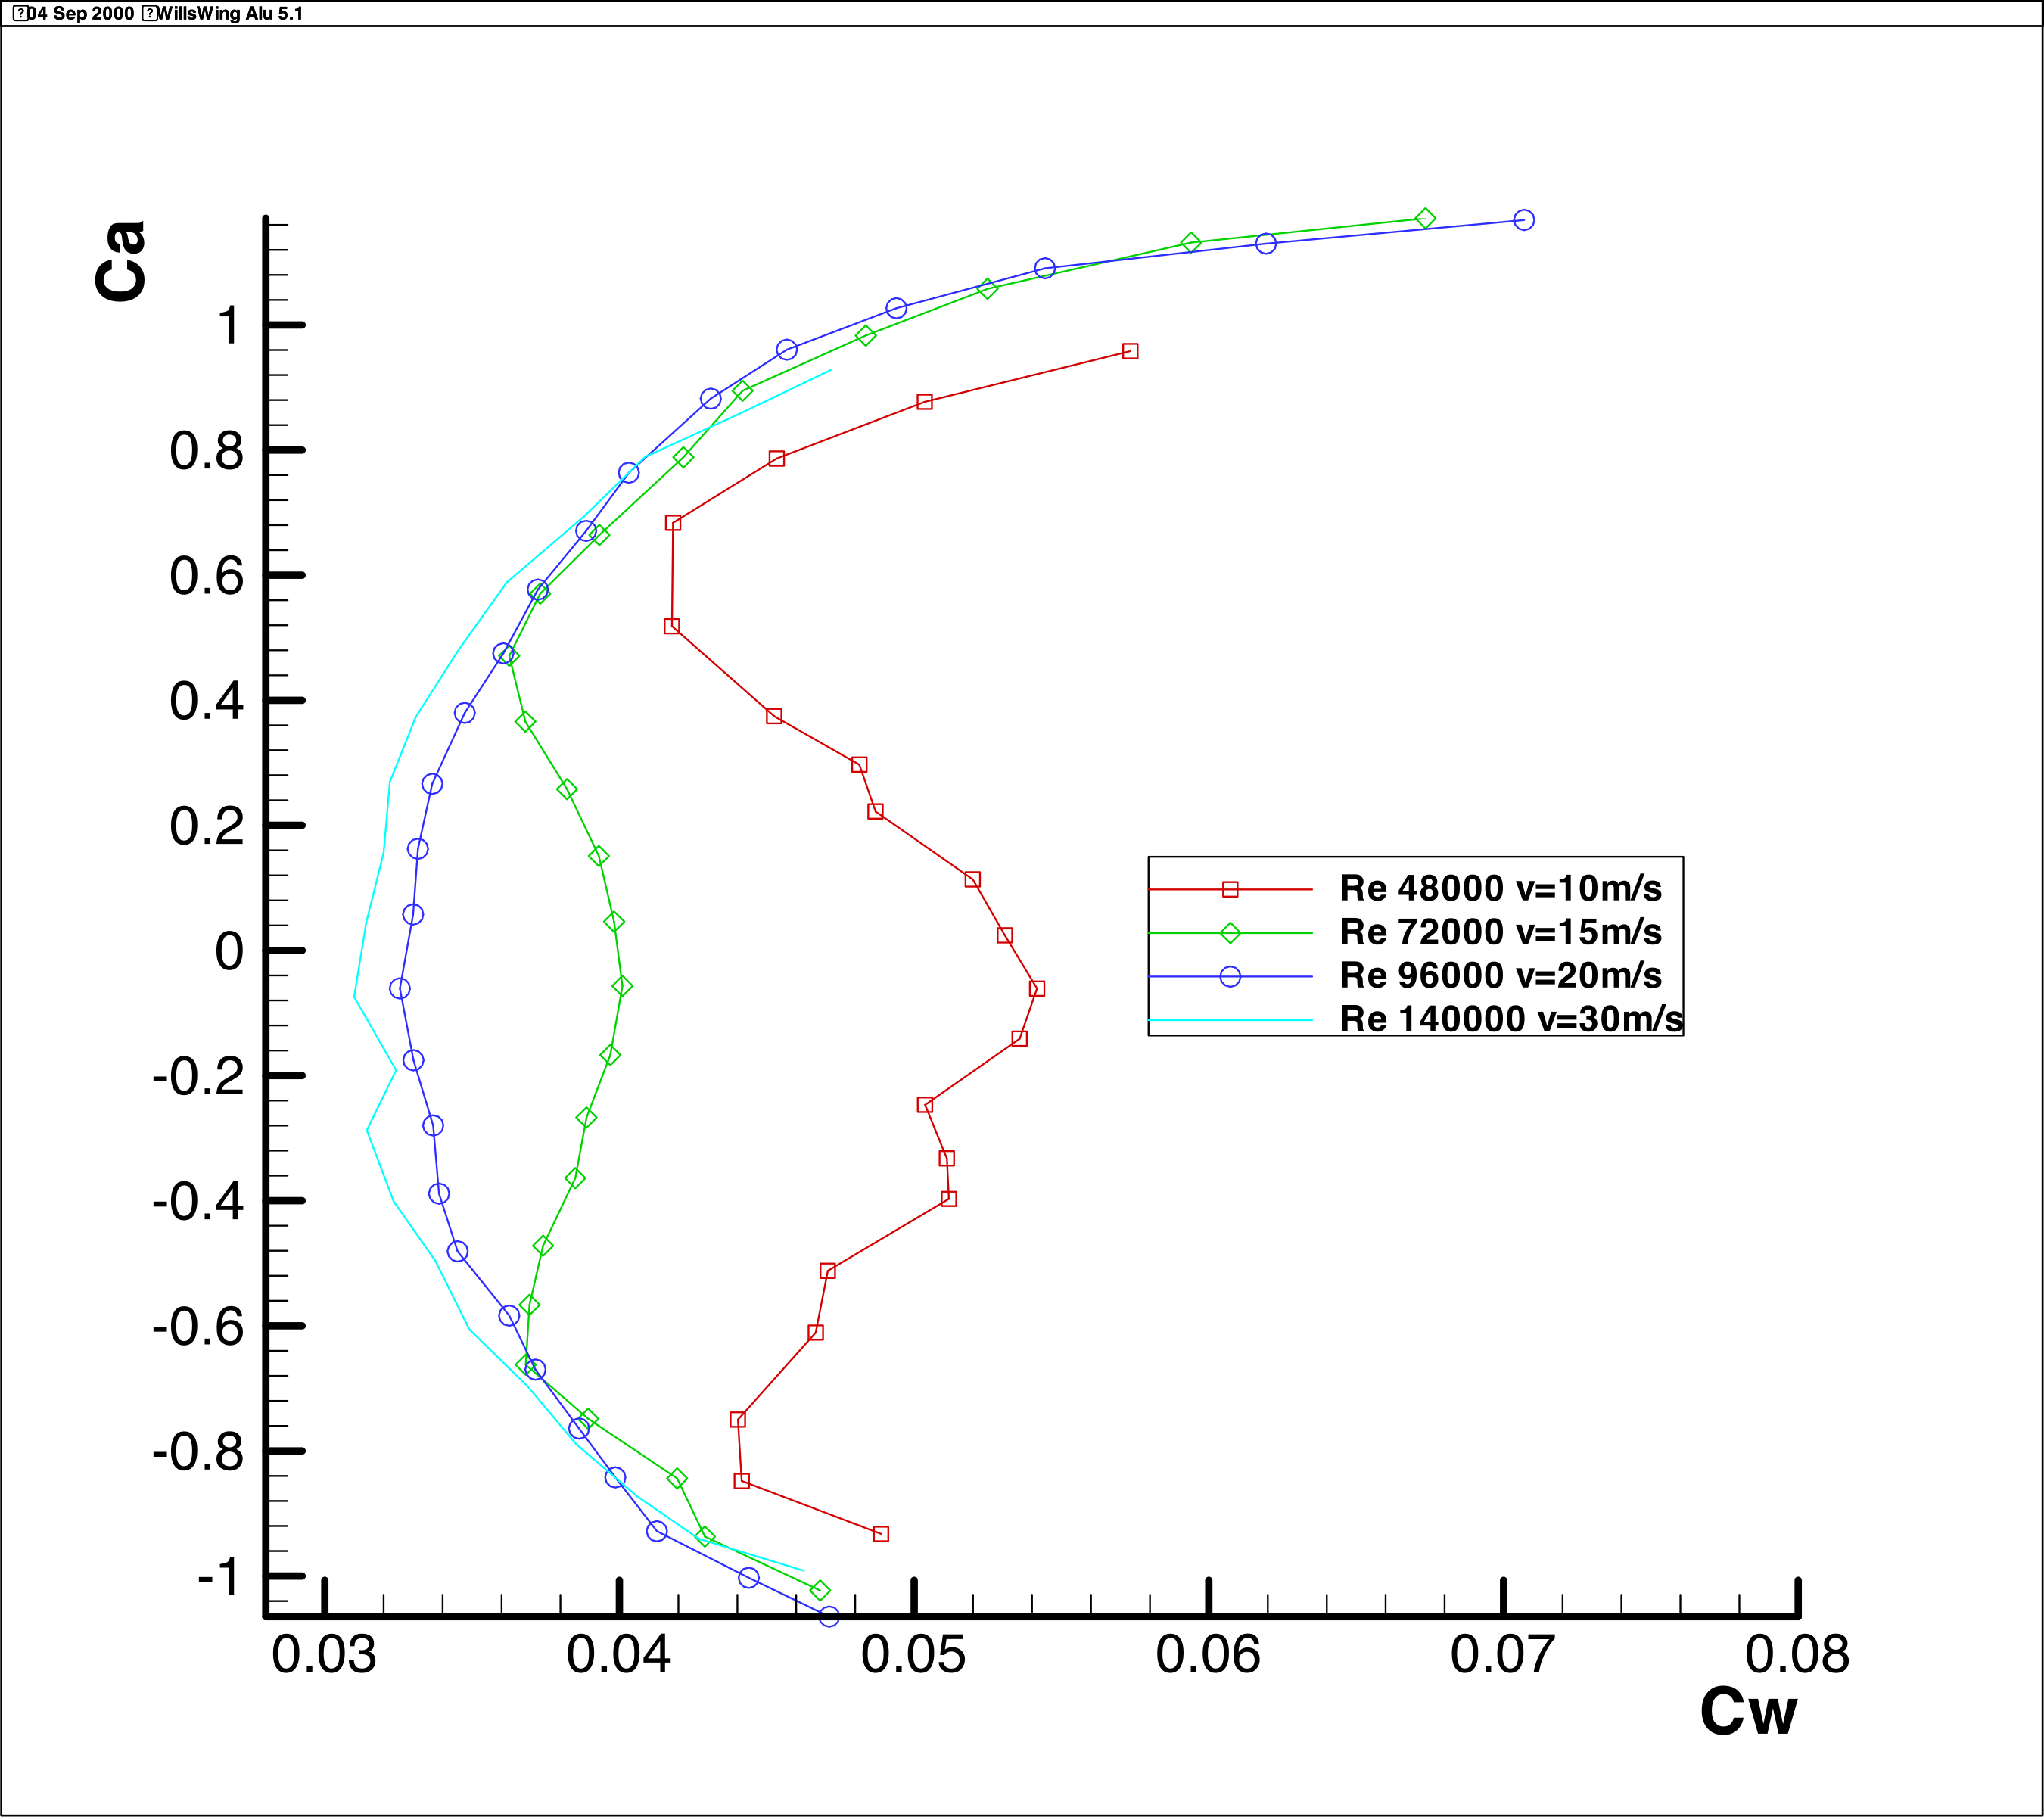
Figure 5.1-1: CL-CD Diagram Wills Wing Aluminum Profile 5.1
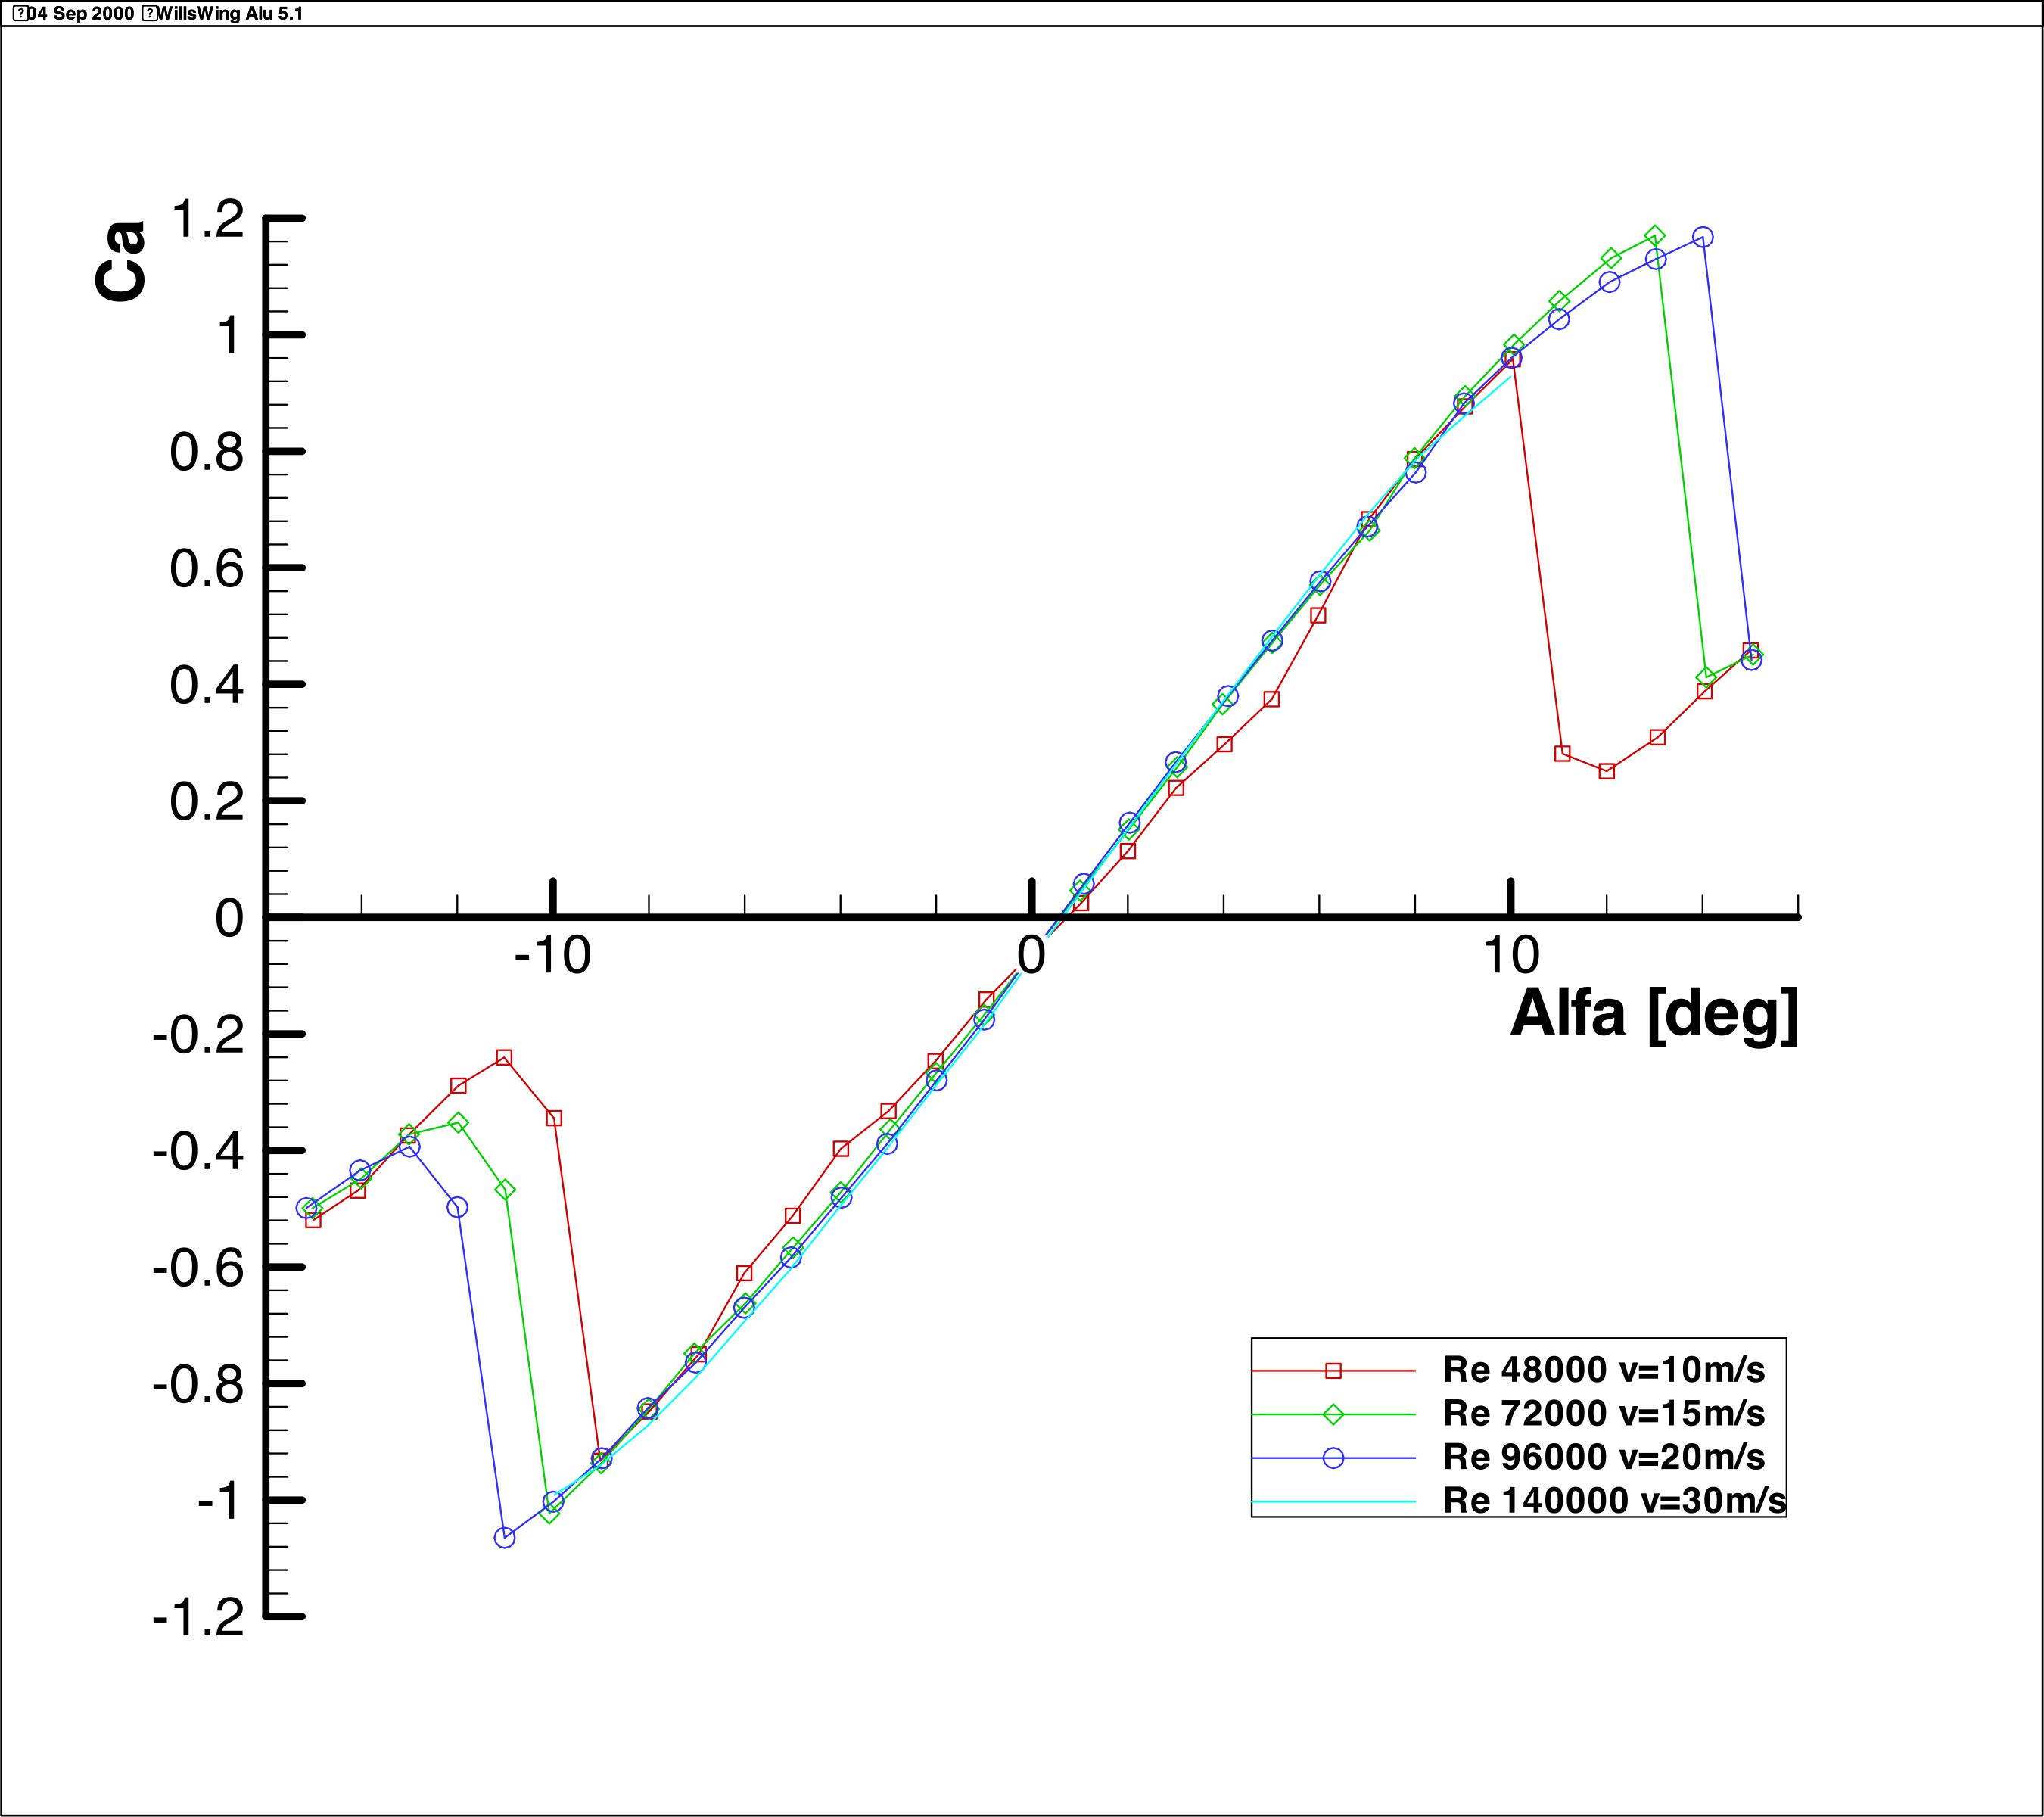
Figure 5.1-2: CL-α Diagram Wills Wing Aluminum Profile 5.1
5.2 Wills Wing Aluminum Profile
Due to the good measurement results with the original configuration, only spot-check measurements were carried out with the above-mentioned turbulators at different positions. No further performance improvement could be achieved, which is why further polar measurements were omitted here.
Appendix 1: Test Specifications
List of sections to test and general instructions
Test sections (altogether 11):
1.1 Wills Wing Carbon down tube, standard trip (76.2 × 19.5mm)
1.2 Wills Wing Carbon down tube (76.2 × 19.5mm) with sailplane zig-zag trip
1.3 Wills Wing Carbon down tube (76.2 × 19.5mm) with vinyl V trip
1.4 Wills Wing Carbon down tube (76.2 × 19.5mm) with no trip
2.1 Seedwings down tube (62.2 × 25mm)
3.1 Aluminum round down tube (28.575mm) — as a reference to analytical and other tunnel data
3.2 Aluminum round tube (28.575mm) with trip
4.1 Finsterwalder down tube (as an industry standard reference)
4.2 Wills Wing aluminum standard down tube (50.8 × 25.4mm)
5.1 Wills Wing aluminum streamlined down tube (76.2 × 22mm)
5.2 Wills Wing aluminum streamlined down tube (76.2 × 22mm) with vinyl V trip — if testing is indicated by the previous testing with the carbon standard down tube (76.2 × 19.5mm) with vinyl V trip
General instructions:
The test velocities are 10m/s, 15m/s, 20m/s and 30m/s.
For all tests, except #3.1: the angle of attack range from −15° to +15° should be tested. If no hysteresis is observed in the lift/drag curve when approaching compared to departing 0 angle of attack at the 10m/s test speed, testing at higher speeds may be limited to 0° to +15°.
Additional Resources: The original measurement data files (.dat), profile geometry definitions, and high-resolution chart images are available on GitHub at github.com/pearson00/Aifoil.